
- Title
-
prdm1a drives a fate switch between hair cells of different mechanosensory organs
- Authors
- Sandler, J.E., Tsai, Y.Y., Chen, S., Sabin, L., Lush, M.E., Sur, A., Ellis, E., Tran, N.T.T., Cook, M., Scott, A.R., Kniss, J.S., Farrell, J.A., Piotrowski, T.
- Source
- Full text @ Nat. Commun.
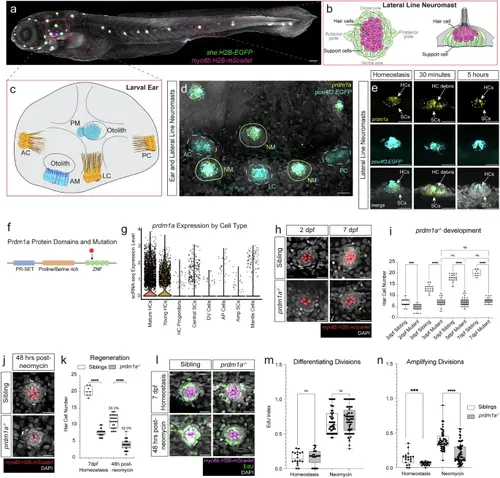
prdm1a expression is integral to hair cells with mutant phenotypes during development and regeneration. a 5 dpf representative zebrafish embryo with hair cells expressing Tg(myo6b:H2B-mScarlet) in magenta and support cells expressing Tg(she:H2B-EGFP) in green, respectively. Scale bar= 100 µm. b Modified schematic of the lateral line with hair cells and support cells in magenta and green, respectively20. c Schematic of the zebrafish ear. AC anterior crista, LC lateral crista, PC posterior crista, AM anterior macula, PM posterior macula. d HCR of lateral line neuromasts and cristae of the zebrafish ear with prdm1a probe and Tg(pou4f3:GAP-EGFP) in hair cells. Representative image of one of three larvae. Scale bars= 20 µm. e prdm1a expression in the lateral line during homeostasis, and during regeneration at 30 min and 5 h post-neomycin, with Tg(pou4f3:GAP-EGFP) in hair cells. HC hair cells, SC support cells. Representative images of one of six larvae. f Schematic of Prdm1a protein with major domains and stop codon in prdm1a mutant (black arrow). g Violin plot of prdm1a expression from sibling scRNA-seq, divided by cell type. h Hair cells labeled with Tg(myo6b:H2B-mScarlet) show developmental defects in prdm1a mutant neuromasts at 2 and 7 dpf compared to siblings. Scale bars= 20 µm. i Quantification of hair cells during development in sibling and prdm1a-/- neuromasts. n = 6–10 fish per timepoint and genotype, 3–4 neuromasts per fish. Dots represent individual neuromasts. n = 27 for 2 dpf sibling, n = 23 for 2 dpf prdm1a-/-, n = 18 for 3 dpf sibling, n = 22 for 3 dpf prdm1a-/-, n = 18 for 5 dpf sibling, n = 38 for 5 dpf prdm1a-/-, n = 8 for 7 dpf sibling, and n = 26 for 7 dpf prdm1a-/-. Two-way Anova with Tukey’s multiple comparisons test, ***p < 0.001, ****p < 0.0001. The box plots show the interquartile range (IQR), with the median (central line) and hinges (25th and 75th percentiles), and the whiskers extending from the box to the minimum and maximum values. j Hair cells labeled with Tg(myo6b:H2B-mScarlet) show regeneration defects in prdm1a-/- neuromasts 48 hours after neomycin treatment; 7 dpf. Scale bars= 20 µm. k Quantification of hair cells during regeneration and homeostasis at the same developmental timepoint, in sibling and prdm1a-/- neuromasts. The percentage of regenerated hair cells compared to homeostasis for each condition is shown above the regeneration counts. n = 6–10 fish per timepoint and genotype, 3–4 neuromasts per fish. n = 8 for 7 dpf sibling, n = 26 for 7 dpf prdm1a-/-, n = 30 for 48 hr post neomycin sibling, and n = 35 for 48 hr post neomycin prdm1a-/-. One-way Anova with Tukey’s multiple comparisons test, ****p < 0.0001. The box plots show the interquartile range (IQR), with the median (central line) and hinges (25th and 75th percentiles), and the whiskers extending from the box to the minimum and maximum values. l EdU (green) incorporation and hair cells expressing Tg(myo6b:H2B-mScarlet) (magenta) during development and regeneration in siblings and mutants. Scale bars= 20 µm. Quantification of EdU incorporation in differentiating divisions (m) and amplifying divisions (n) during regeneration in sibling and prdm1a-/- neuromasts. n = 6–8 fish per treatment and genotype, 3–4 neuromasts per fish. n = 18 for homeostasis sibling, n = 25 for homeostasis prdm1a-/-, n = 16 for neomycin sibling, n = 25 for neomycin prdm1a-/-. One-way Anova with Tukey’s multiple comparisons test, ****p < 0.0001. The box plots show the interquartile range (IQR), with the median (central line) and hinges (25th and 75th percentiles), and the whiskers extending from the box to the minimum and maximum values. |
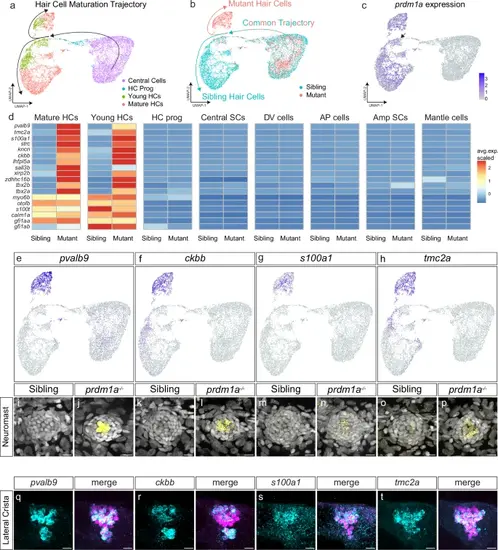
scRNA-seq indicates a hair cell differentiation fate switch in prdm1a mutants. a UMAP plot of prdm1a-/- and sibling scRNA-seq, from central support cells to mature hair cells, colored by cell type. Black arrows indicate developmental trajectory. b UMAP plot of prdm1a-/- and sibling scRNA-seq, from central support cells to mature hair cells, colored by genotype. c Feature plot of prdm1a expression in the scRNA-seq hair cell lineage sub-clustering. d Heatmap of selected genes upregulated in prdm1a-/- hair cells, and non-differentially expressed hair cell marker genes. e–h Feature plots of pvalb9, ckbb, s100a1 and tmc2a from the hair cell trajectory sub-clustered scRNA-seq. i–p HCRs of pvalb9, ckbb, s100a1 and tmc2a in 5 dpf sibling and prdm1a-/- neuromasts. Representative images of two independent experiments. q–t HCRs of pvalb9, ckbb, s100a1 and tmc2a in the lateral crista of the ear in Tg(myo6b: H2B-mScarlet) larvae, with hair cells are labeled in magenta. Scale bars= 10 µm. Representative images of two independent experiments |
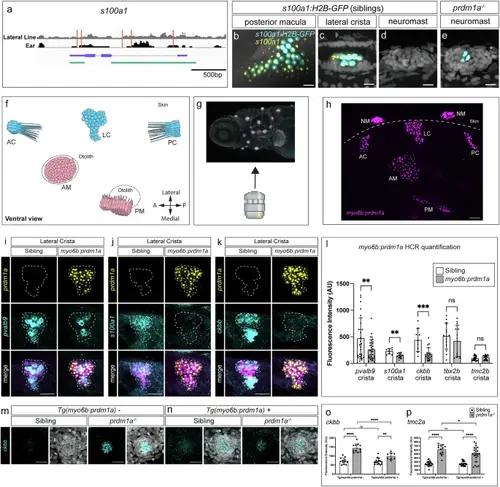
prdm1a regulates the expression of target genes in the ear. a Schematic of the s100a1 locus showing lateral line (gray) or ear (black) ATAC-seq reads with location of Prdm1 binding motifs in red. Exons and introns in purple. Cloned enhancer-promoter fusion of Tg(s100a1:H2B-EGFP) in green. s100a1 HCR (yellow) and H2B-GFP expression (cyan) in 5 dpf wild type embryos driven by Tg(s100a1:H2B-EGFP) in the posterior macula (b) and lateral crista (c). 5 dpf sibling neuromast (d) and prdm1a-/- dorsal neuromast (e). Scale bars= 10 µm. Representative images of two independent experiments. f Illustration of the zebrafish ear from a ventral view and orientation of the larva during imaging. AC anterior crista, LC lateral crista, PC posterior crista, AM anterior macula, PM posterior macula, NM neuromast. Ventral view of the zebrafish ear. Created in BioRender. Piotrowski, T. (2025) https://BioRender.com/vl2w553 (g), HCR with a prdm1a probe (magenta) in a Tg(myo6b:prdm1a) larva (h). Generated using Biorender. Representative images of six independent experiments. Scale bars= 20 µm (i–k) HCR signals for prdm1a (yellow), pvalb9, s100a1, and ckbb (cyan) in the lateral crista of sibling and the Tg(myo6:prdm1a; cryaa:mTurqoise2) embryos, respectively. Scale bars= 10 µm. Images are representative of embryos from two independent experiments. l Quantification of fluorescent signal from HCRs of pvalb9 (p = 0.0081), s100a1 (p = 0.0018), ckbb (p = 0.0003), tbx2b (p = 0.3699), and tmc2b (p = 0.2497). n = 8 embryos (two ears each) imaged per probe and genotype. Multiple unpaired two-sided t-test, ns>0.05, **p < 0.01, ***p < 0.001. Data are presented as mean ± SD. m HCRs of ckbb in sibling and prdm1a mutant neuromasts. Images representative of two independent experiments. n Expression of ckbb in prdm1a-/- hair cells using the Tg(myo6:prdm1a; cryaa:mTurqoise2) line downregulates the expression of ckbb. Scale bars= 10 µm. Images representative of two independent experiments. o Quantification of ckbb expression in the various conditions. n = 12 for sibling, n = 11 for prdm1a-/-, n = 15 for ectopic prdm1a-expressing sibling and n = 8 for ectopic prdm1a-expressing prdm1a-/-. Two-way Anova with Tukey’s multiple comparisons test, *p < 0.05, **p < 0.01(**p = 0.0069), ***p < 0.001, ****p < 0.0001. Data are presented as mean ± SD. p Quantification of tmc2a HCR fluorescence intensity in the various conditions. n = 21 for sibling, n = 12 for prdm1a-/-, n = 23 for ectopic prdm1a-expressing sibling and n = 23 for ectopic prdm1a-expressing prdm1a-/-. Two-way Anova with Tukey’s multiple comparisons test, *p < 0.05(*p = 0.0262), **p < 0.01, ***p < 0.001, ****p < 0.0001. Data are presented as mean ± SD. |
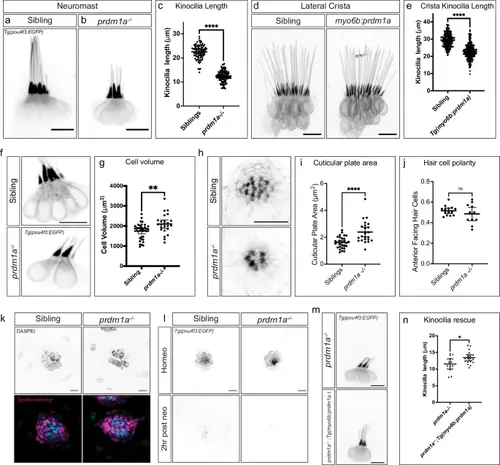
prdm1a mutant hair cell morphology changes concordant with expression changes. a,b Tg(pou4f3:EGFP) in sibling and prdm1a-/- neuromast hair cells. c Quantification of neuromast kinocilia length in sibling and prdm1a-/- hair cells. n = 11 sibling neuromasts, 89 kinocilia; n = 21 prdm1a-/- neuromasts, 117 kinocilia. Student’s two-sided t-test, ****p = 8.165*10-73. Data are presented as mean ± SD. d Tg(pou4f3:EGFP) expression in sibling and Tg(myo6b:prdm1a) cristae. Scale bars= 10 µm. e Quantification of Tg(myo6b:prdm1a) cristae kinocilia length. n = 15 sibling cristae, 226 kinocilia; n = 15 Tg(myo6b:prdm1a) cristae, 258 kinocilia. Student’s two-sided t-test, ****p = 7.314*10-54. Data are presented as mean ± SD. f Tg(pou4f3:EGFP) labeling cell bodies in sibling and prdm1a-/- lateral line hair cells. g Quantification of cell body volume in sibling and prdm1a-/- lateral line hair cells. n = 12 sibling neuromasts, 37 cell bodies; n = 11 prdm1a-/- neuromasts, 24 cell bodies. Student’s two-sided t test, **p = 0.0026. Data are presented as mean ± SD. h Phalloidin staining of sibling and prdm1a-/- neuromasts. i Quantification of cuticular plate area in sibling and prdm1a-/- neuromasts. n = 14 sibling neuromasts, 29 cuticular plates; n = 10 prdm1a-/- neuromasts, 23 cuticular plates. Student’s two-sided t-test, ****p = 6.296*10-5. Data are presented as mean ± SD. j Quantification of the percentage of anterior-polarized hair cells per neuromast. n = 14 sibling neuromasts and n = 10 prdm1a-/- neuromasts. Student’s two-sided t-test p = 0.2916. Data are presented as mean ± SD. k DASPEI uptake in sibling and prdm1a-/- lateral line hair cells. Representative of two independent experiments with similar results. l Tg(pou4f3:EGFP) in sibling and prdm1a-/- lateral line hair cells during homeostasis and 2 h after neomycin treatment. Representative of two independent experiments with similar results. m Tg(myo6b:prdm1a) overexpression in prdm1a-/- hair cells. n Quantification of kinocilia length in Tg(myo6b:prdm1a) positive and negative prdm1a-/- hair cells. n = 12 Tg(myo6b:prdm1a) negative neuromasts, 12 kinocilia; n = 19 Tg(myo6b:prdm1a) positive neuromasts. Student’s two-sided t-test p = 0.0174. Data are presented as mean ± SD. All Scale bars = 10 µm. |
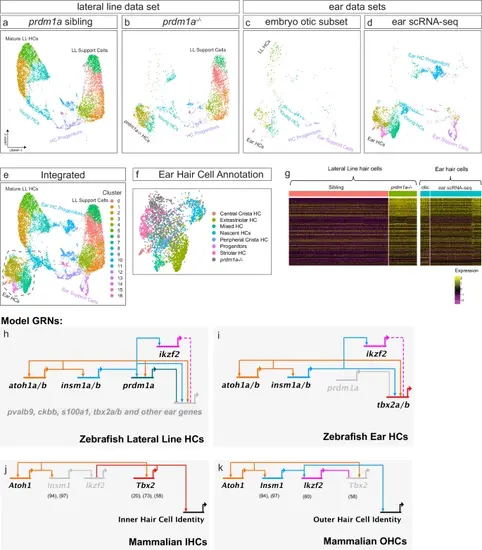
Integrating ear scRNA-seq to build a hair cell differentiation GRN.a–e UMAPs of integrated scRNA-seq, showing sibling lateral line, prdm1a-/- lateral line, embryo otic subset, ear scRNA-seq, and complete integration, respectively. f Integrated ear prdm1a-/- hair cell cluster with cells color coded by cell type from the ear scRNA-seq annotation5. prdm1a-/- hair cells are in gray. g Heatmap of mature hair cell genes of the triple integrated scRNA-seq data set, divided into prdm1a-/- lateral line cells, ear hair cells of the embryo otic subset and ear scRNA-seq data sets. h GRN of zebrafish lateral line hair cell specification and development. i GRN of zebrafish ear hair cell specification and development. j GRN of mouse inner hair cell specification and development. k GRN of mouse outer hair cell specification and development. Numbers in brackets indicate citations for the individual interactions. |