
|
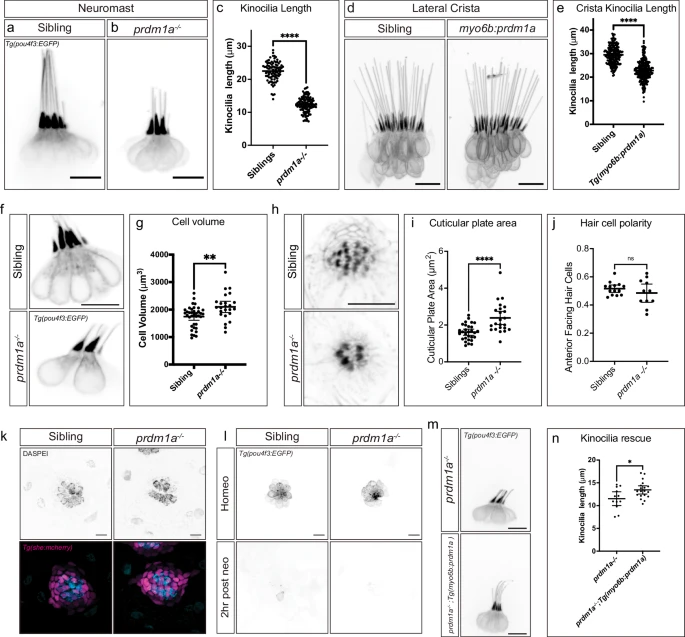
Fig. 4 prdm1a mutant hair cell morphology changes concordant with expression changes. a,b Tg(pou4f3:EGFP) in sibling and prdm1a-/- neuromast hair cells. c Quantification of neuromast kinocilia length in sibling and prdm1a-/- hair cells. n = 11 sibling neuromasts, 89 kinocilia; n = 21 prdm1a-/- neuromasts, 117 kinocilia. Student’s two-sided t-test, ****p = 8.165*10-73. Data are presented as mean ± SD. d Tg(pou4f3:EGFP) expression in sibling and Tg(myo6b:prdm1a) cristae. Scale bars= 10 µm. e Quantification of Tg(myo6b:prdm1a) cristae kinocilia length. n = 15 sibling cristae, 226 kinocilia; n = 15 Tg(myo6b:prdm1a) cristae, 258 kinocilia. Student’s two-sided t-test, ****p = 7.314*10-54. Data are presented as mean ± SD. f Tg(pou4f3:EGFP) labeling cell bodies in sibling and prdm1a-/- lateral line hair cells. g Quantification of cell body volume in sibling and prdm1a-/- lateral line hair cells. n = 12 sibling neuromasts, 37 cell bodies; n = 11 prdm1a-/- neuromasts, 24 cell bodies. Student’s two-sided t test, **p = 0.0026. Data are presented as mean ± SD. h Phalloidin staining of sibling and prdm1a-/- neuromasts. i Quantification of cuticular plate area in sibling and prdm1a-/- neuromasts. n = 14 sibling neuromasts, 29 cuticular plates; n = 10 prdm1a-/- neuromasts, 23 cuticular plates. Student’s two-sided t-test, ****p = 6.296*10-5. Data are presented as mean ± SD. j Quantification of the percentage of anterior-polarized hair cells per neuromast. n = 14 sibling neuromasts and n = 10 prdm1a-/- neuromasts. Student’s two-sided t-test p = 0.2916. Data are presented as mean ± SD. k DASPEI uptake in sibling and prdm1a-/- lateral line hair cells. Representative of two independent experiments with similar results. l Tg(pou4f3:EGFP) in sibling and prdm1a-/- lateral line hair cells during homeostasis and 2 h after neomycin treatment. Representative of two independent experiments with similar results. m Tg(myo6b:prdm1a) overexpression in prdm1a-/- hair cells. n Quantification of kinocilia length in Tg(myo6b:prdm1a) positive and negative prdm1a-/- hair cells. n = 12 Tg(myo6b:prdm1a) negative neuromasts, 12 kinocilia; n = 19 Tg(myo6b:prdm1a) positive neuromasts. Student’s two-sided t-test p = 0.0174. Data are presented as mean ± SD. All Scale bars = 10 µm.