
- Title
-
Bisphenol A and its analogs perturb primitive myelopoiesis and inhibit innate immune cell formation during early developmental stages of zebrafish
- Authors
- Zhang, L., Hong, X., Liu, W., Li, Z., Wang, J., Yan, S., Zha, J.
- Source
- Full text @ Environ. Int.

Schematic overview of the experimental design used in this study. (A) Summary of the experimental procedures used to assess the toxicity of bisphenols on the development of innate immune cells. (B) Timeline of the experimental procedures utilized to detect different markers of hematopoiesis. |
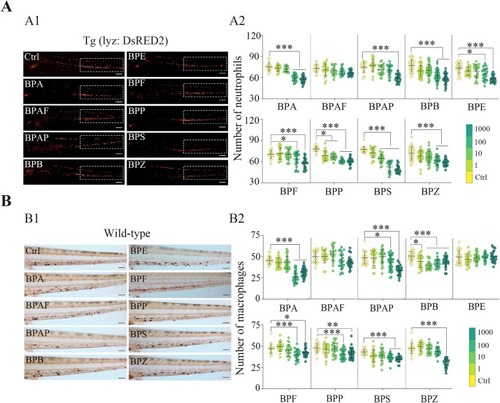
Effects of BPA and its analogs on the number of innate immune cells in zebrafish embryos at 72 hpf. (A) The number of neutrophils in Tg (lyz: DsRED2) zebrafish embryos; A1, representative fluorescence images of neutrophils from the control and 1000 μg/L bisphenol treatment groups; the white rectangle shows the caudal hematopoietic tissue (CHT) area in the tail of the embryos; A2, statistical maps of the number of neutrophils in the CHT region. (B) The number of macrophages in wild-type AB zebrafish embryos; B1, representative images of neutral red-labeled macrophages from the control and 1000 μg/L bisphenol treatment groups; B2, statistical analysis of macrophages. The results are shown as the mean ± SDs (n ≥ 20). Significant differences between bisphenol treatments and controls are denoted by asterisks (*p < 0.05, ** p < 0.01, *** p < 0.001). Scale bars represent 500 μm (A1) and 200 μm (B1). |
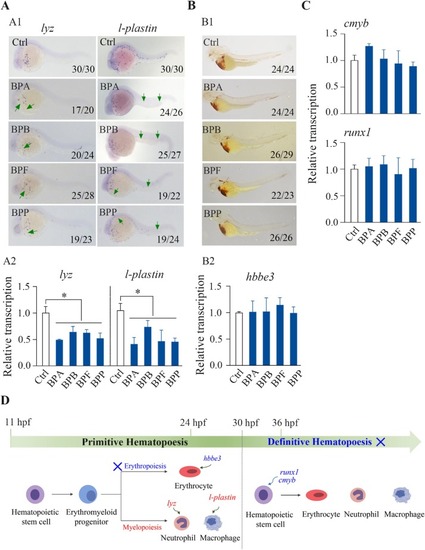
Effects of BPA, BPB, BPF, and BPP on zebrafish hematopoiesis. The transcriptional levels of primitive myelopoiesis marker genes, including lyz and l-plastin, were analyzed via WISH (A1) and qPCR (A2) in 24 hpf embryos exposed to 1000 μg/L BPA, BPB, BPF, or BPP. The hemoglobin activity of erythrocytes at 72 hpf (B1) and the relative expression of hbbe3 at 24 hpf (B2) in embryos exposed to 1000 μg/L BPA, BPB, BPF, or BPP were analyzed by o-dianisidine staining and qPCR, respectively. The transcriptional levels of definitive hematopoiesis marker genes, including cmyb and runx1 (C), were analyzed by qPCR in 36 hpf embryos exposed to 1000 μg/L BPA, BPB, BPF, or BPP. A schematic diagram of hematopoiesis during early zebrafish development revealed that BPA, BPB, BPF, and BPP inhibited primitive myelopoiesis but not definitive hematopoiesis or primitive erythropoiesis (D); significantly affected endpoints are marked in red, whereas unaffected endpoints are marked in blue. A1 and B1, the number shown in the lower right-hand corner of each picture is the number of embryos exhibiting the typical phenotype shown in the picture to the total number of embryos observed. A2, B2, and C, relative transcriptional levels are shown as the mean ± SDs (n = 3). Significant differences between bisphenol-treated and control groups are denoted by asterisks (p < 0.05). |
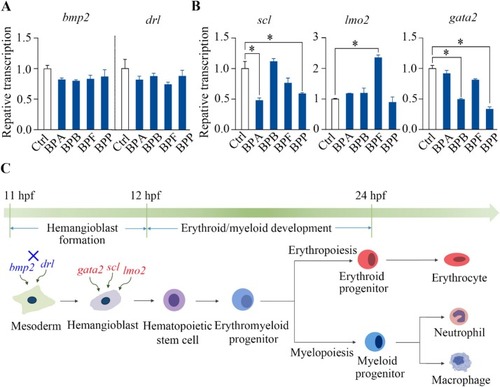
Effects of BPA, BPB, BPF, and BPP on hemangioblast formation during zebrafish development. qPCR analysis showing the transcriptional levels of the marker genes bmp2 and drl for the mesoderm (A) as well as scl, lmo2, and gata2 for hematopoietic progenitors (B) in embryos exposed to 1000 μg/L BPA, BPB, BPF, and BPP at 12 hpf. A schematic diagram of hematopoiesis during early zebrafish development shows that BPA, BPB, BPF, and BPP repressed the formation of anterior hemangioblasts (C); significantly affected end points are marked in red, whereas unaffected end points are marked in blue. The results are shown as the means ± SDs (n = 3). Significant differences between bisphenol-treated and control groups are denoted by asterisks (p < 0.05). |
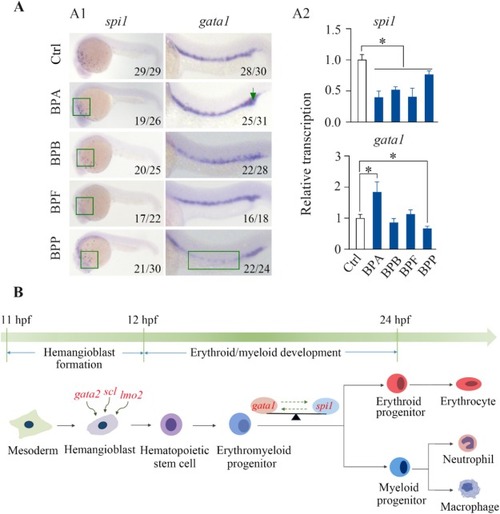
Effects of BPA, BPB, BPF, and BPP on the differentiation of hemangioblasts during zebrafish development. WISH (A1) and qPCR (A2) analyses revealed the transcriptional levels of the spi1 and gata1 genes in embryos exposed to 1000 μg/L BPA, BPB, BPF, or BPP at 24 hpf. Schematic diagram of hematopoiesis during early zebrafish development showing that BPA, BPB, BPF, and BPP blocked the differentiation of hemangioblasts into myeloid progenitor cells through regulating spi1 and gata1 expression (B); significantly affected endpoints are marked in red. The number shown in the lower right-hand corner of each picture is the number of embryos exhibiting the typical phenotype shown in the picture to the total number of embryos observed. The qPCR results are shown as the means ± SD (n = 3). Significant differences between bisphenol-treated and control groups are denoted by asterisks (p < 0.05). |
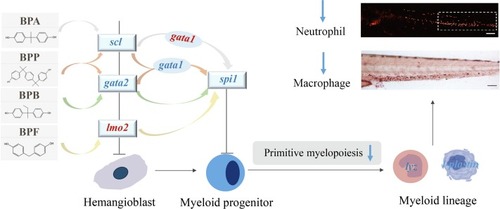
Potential mechanisms of developmental immunotoxicity induced by BPA, BPB, BPF, and BPP. The upregulated genes are shown in red, and the downregulated genes are shown in blue. |