
|
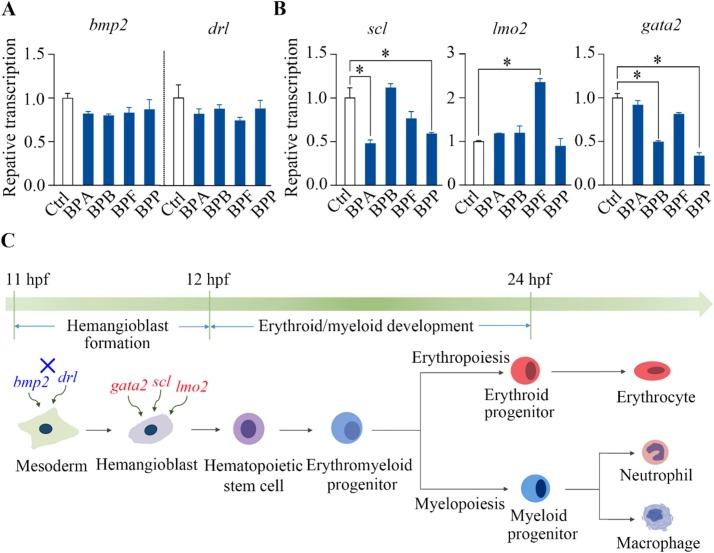
Fig. 4 Effects of BPA, BPB, BPF, and BPP on hemangioblast formation during zebrafish development. qPCR analysis showing the transcriptional levels of the marker genes bmp2 and drl for the mesoderm (A) as well as scl, lmo2, and gata2 for hematopoietic progenitors (B) in embryos exposed to 1000 μg/L BPA, BPB, BPF, and BPP at 12 hpf. A schematic diagram of hematopoiesis during early zebrafish development shows that BPA, BPB, BPF, and BPP repressed the formation of anterior hemangioblasts (C); significantly affected end points are marked in red, whereas unaffected end points are marked in blue. The results are shown as the means ± SDs (n = 3). Significant differences between bisphenol-treated and control groups are denoted by asterisks (p < 0.05).