
|
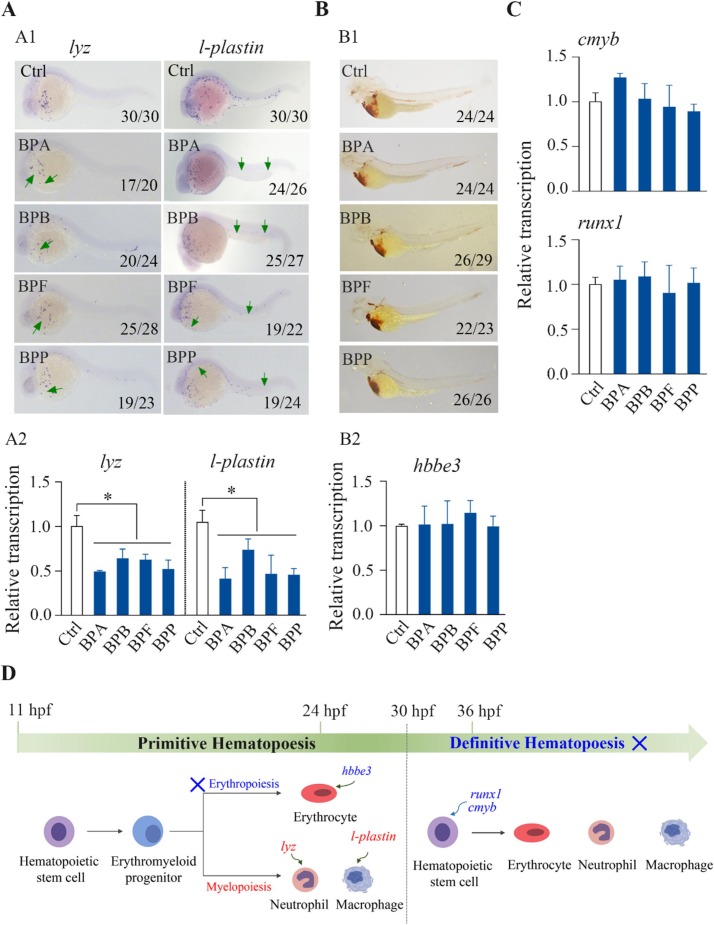
Fig. 3 Effects of BPA, BPB, BPF, and BPP on zebrafish hematopoiesis. The transcriptional levels of primitive myelopoiesis marker genes, including lyz and l-plastin, were analyzed via WISH (A1) and qPCR (A2) in 24 hpf embryos exposed to 1000 μg/L BPA, BPB, BPF, or BPP. The hemoglobin activity of erythrocytes at 72 hpf (B1) and the relative expression of hbbe3 at 24 hpf (B2) in embryos exposed to 1000 μg/L BPA, BPB, BPF, or BPP were analyzed by o-dianisidine staining and qPCR, respectively. The transcriptional levels of definitive hematopoiesis marker genes, including cmyb and runx1 (C), were analyzed by qPCR in 36 hpf embryos exposed to 1000 μg/L BPA, BPB, BPF, or BPP. A schematic diagram of hematopoiesis during early zebrafish development revealed that BPA, BPB, BPF, and BPP inhibited primitive myelopoiesis but not definitive hematopoiesis or primitive erythropoiesis (D); significantly affected endpoints are marked in red, whereas unaffected endpoints are marked in blue. A1 and B1, the number shown in the lower right-hand corner of each picture is the number of embryos exhibiting the typical phenotype shown in the picture to the total number of embryos observed. A2, B2, and C, relative transcriptional levels are shown as the mean ± SDs (n = 3). Significant differences between bisphenol-treated and control groups are denoted by asterisks (p < 0.05).