
- Title
-
Sox11 genes affect neuronal differentiation in the developing zebrafish enteric nervous system
- Authors
- Huang, Y., Li, C., Desingu Rajan, A.R., Bronner, M.E.
- Source
- Full text @ Proc. Natl. Acad. Sci. USA
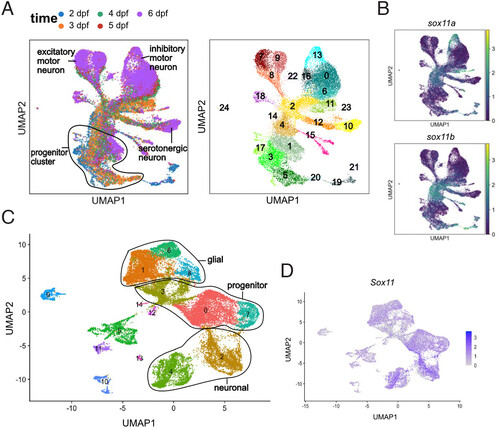
Sox11a and sox11b expression in zebrafish and Sox11 expression in chicken developing ENS (A) UMAP of single-cell (sc) RNA-seq of zebrafish ENS development. It covers the transition from progenitor cells to mature neurons in ENS development. (B) UMAP showing the expression pattern of sox11a and sox11b in zebrafish ENS development, suggesting their roles in affecting neuronal differentiation. (C) UMAP of scRNA-seq experiment on chicken ENS development (D) UMAP showing the expression pattern of Sox11 in chicken ENS development. |
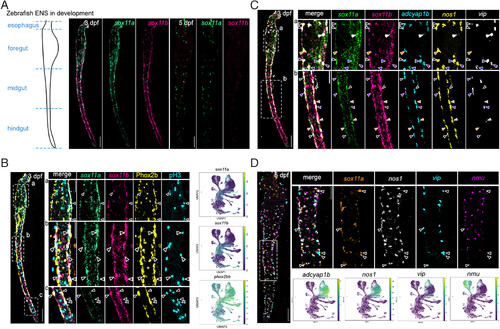
Sox11a and sox11b expression overlap with inhibitory motor neuron clusters. All staining images were after “Max Intensity” z-stack projection. (A) Left: Illustration of zebrafish developing ENS separated into foregut, midgut, and hindgut. Right: Transient expression of both sox11a and sox11b in gut at 3 dpf, and only sox11a expression at 5 dpf. (Scale bar, 100 μm.) (B) Overlapping expression of sox11a, sox11b, Phox2b, and pH3 in the ENS at 3 dpf. The white dash box indicates the zoomed region on the right. Arrows indicate cells coexpressing sox11a/b, Phox2b and proliferation marker pH3. (Scale bar, 100 μm, and 50 μm for zoomed region.) (C) Coexpression pattern between sox11a, sox11b, and inhibitory motor neuron markers, adcyap1b, vip, and nos1 at 3 dpf. The white dash box indicates the zoomed region on the right. Arrows point to cells coexpressing sox11a/b and neuronal markers: hollow arrows:sox11a+/sox11b+/adcyap1b+/nos1+/vip− cells, white arrows:sox11a+/sox11b+/adcyap1b−/nos1−/vip+ cells, orange arrows:sox11a−/sox11b+/adcyap1b+/nos1+/vip− cells, purple arrows:sox11a+/sox11b+/adcyap1b+/nos1+/vip+ cells, blue arrows:sox11a+/sox11b−/adcyap1b+/nos1+/vip+ cells. (Scale bar, 100 μm, and 50 μm for zoomed region.) (D) Coexpression pattern between sox11a and only vip at 5 dpf. The white dash box indicates the zoomed region on the right. Arrows indicate cells coexpressing sox11a and vip. (Scale bar, 100 μm, and 50 μm for zoomed region.) |
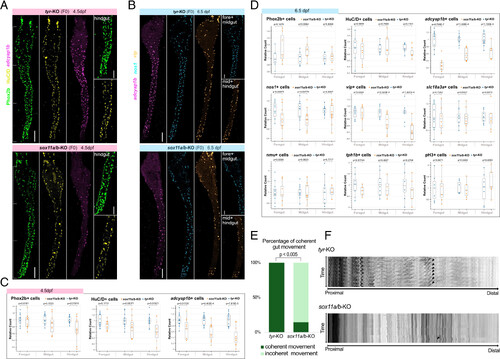
Quantification analysis reveals differences between sox11a/b knock-out and control embryos. All staining images were after “Max Intensity” z-stack projection. (A) Antibody and HCR staining comparing the expression levels of Phox2b, HuC/D, and adcyap1b in sox11a/b knock-out embryos (Top) with the control embryos (Bottom) at 4.5 dpf. On the right, hindgut regions that showed a significant difference in cells expressing Phox2b and HuC/D were zoomed in. A significant difference in adcyap1b expression was observed throughout the whole gut. (Scale bar, 100 μm, and 50 μm for zoomed region.) (B) Antibody and HCR staining comparing the expression levels of adcyap1b, nos1, and vip in sox11a/b knock-out embryos with the control embryos at 6.5 dpf. On the right, corresponding regions that showed a significant difference in cells expressing nos1 and vip were zoomed in. A significant difference in adcyap1b expression was observed throughout the whole gut. (Scale bar, 100 μm, and 50 μm for zoomed region.) (C) At 4.5 dpf, an overall developmental delay was observed in sox11a/b knock-out embryos (Nsox11a/b = 11, Ntyr = 14, replicates = 3). (D) At 6.5 dpf, a specific reduction of the inhibitory motor neuron cluster was observed in sox11a/b knock-out embryos, particularly in adcyap1b expression (for Phox2b and HuC/D, Nsox11a/b = 7, Ntyr = 7, replicates = 3; For other neuronal markers, Nsox11a/b = 8, Ntyr = 12, replicates = 3). (E) A significant increase of incoherent gut movement was found in sox11a/b knock-out embryos. (Nsox11a/b = 7, Ntyr = 8). (F) Kymographs showing the passage of coherent contraction from proximal to distal in tyr knock-out embryos, and little movement at the length of the gut in sox11a/b knock-out embryos. Arrows indicate gut contraction. |
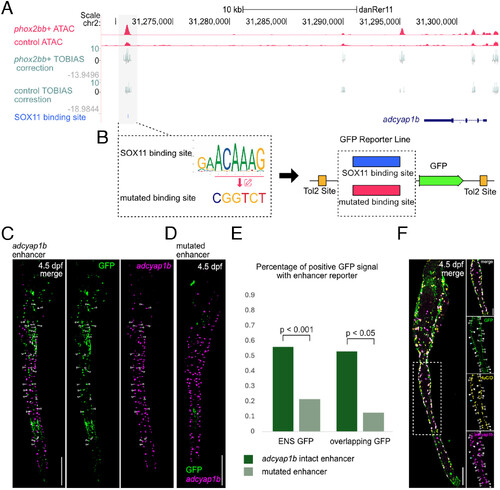
Putative SOX11 binding site in an adcyap1b enhancer. All staining images were after “Max Intensity” z-stack projection. (A) TOBIAS provides Tn5 bias correction of bulk ATAC seq results and SOX11 footprinting. (B) The adcyap1b enhancer with either the intact or mutated SOX11 binding site was cloned into the GFP reporter plasmid. (C) At 4.5 dpf, embryos showed adcyap1b enhancer mediating GFP reporter expression in the gut. Arrows indicate cells coexpressing GFP and adcyap1b. (Scale bar, 100 μm.) (D) At 4.5 dpf, embryos showed a reduction in adcyap1b enhancer-mediated reporter expression after mutation of SOX11 binding sites. (Scale bar, 100 μm.) (E) Enhancers with mutated SOX11 binding site showed a significant reduction in the percentage of positive GFP signal in ENS (ENS GFP, Nadc = 60, Nmut = 51, replicates = 3; overlapping GFP, Nadc = 17, Nmut = 16, replicates = 3). (F) Antibody and HCR staining comparing coexpression of GFP signals, HuC/D and adcyap1b in ENS of Tg(+32adcyap1b:GFP) at 4.5 dpf. The white dash box indicates the zoomed region on the right. Hollow arrows point to GFP+/HuC/D+/adcyap1b+ cells, white arrows point to GFP+/HuC/D+/adcyap1b− cells, and blue arrows point to GFP+/HuC/D−/adcyap1b− cells. (Scale bar, 100 μm, and 50 μm for zoomed region.) |
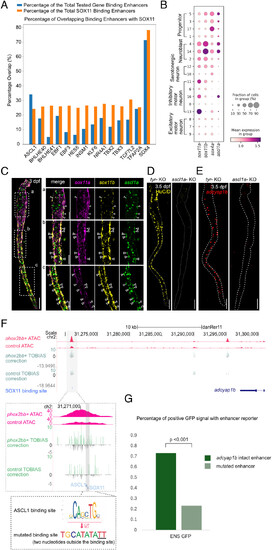
ASCL1 has a binding site adjacent to the putative binding site of SOX11. All staining images were after “Max Intensity” z-stack projection. (A) SOX4 and ASCL1 show the top percentage of overlapping enhancers that contain putative binding sites with SOX11. (B) scRNA-seq analysis suggested that sox4a was expressed in progenitor clusters, while sox11a, sox11b, and ascl1a were expressed in ENS neuroblasts. (C) At 3 dpf, ascl1a had an overlapping expression with sox11a/b, especially with sox11b. The white dash box indicates the zoomed region on the right. Arrows indicate overlapping expression between ascl1a, sox11a and sox11b. (Scale bar, 100 μm, and 50 μm for the zoomed region.) (D) Representative image of embryo with near complete loss of HuC/D after ascl1a knockout. The dotted line indicates the outline of the gut (Nascl1a = 6, Ntyr = 6, replicates = 2). (Scale bar, 100 μm.) (E) Representative image of embryo with near complete loss of adcyap1b after ascl1a knockout. The dotted line indicates the outline of the gut. (Nascl1a = 6, Ntyr = 6, replicates = 2). (Scale bar, 100 μm.) (F) ASCL1 has a putative binding site in the putative enhancer of adcyap1b. A plasmid was generated with a mutated ASCL1 binding site. (G) Enhancers with mutated ASCL1 binding site showed a significant reduction in the percentage of positive GFP signal in ENS (ENS GFP, Nadc = 60, Nmut = 56, replicates = 4). |
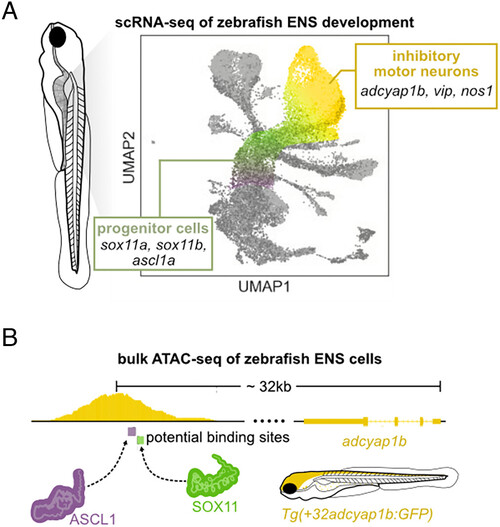
Schematic summary of the results. (A) Identification of sox11a/b expression in progenitors and inhibitory neurons via scRNA-seq, confirmed by HCR. (B) ATAC-seq enables identification of a putative adcyap1b enhancer that contains critical SOX11 binding sites. |