
|
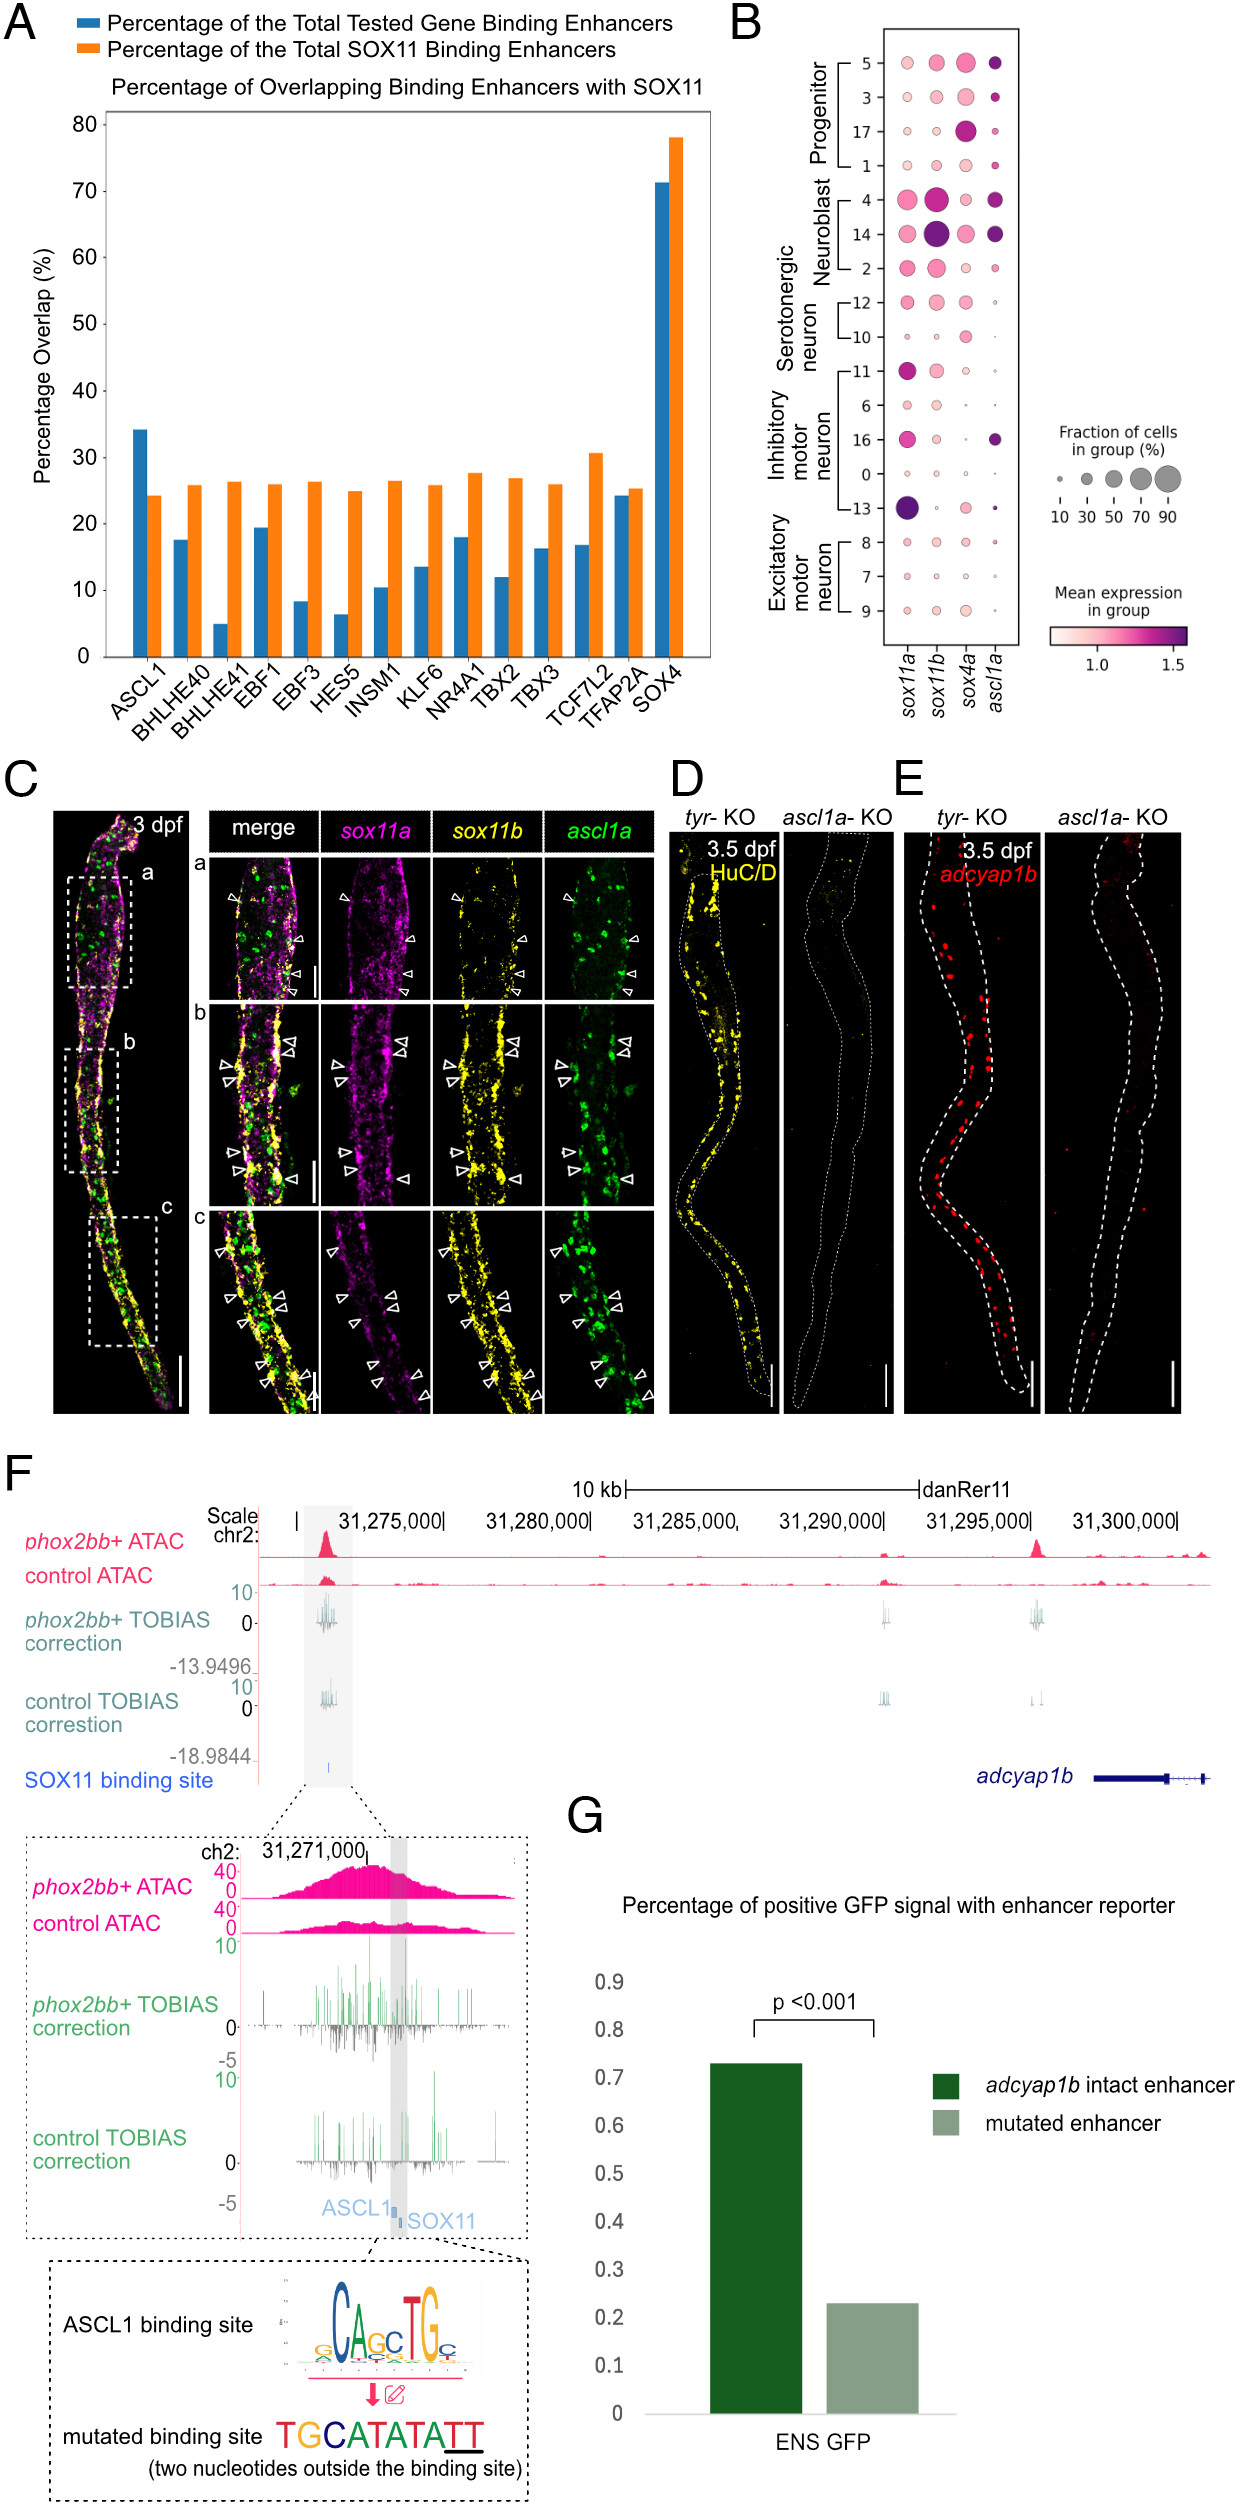
Fig. 5 ASCL1 has a binding site adjacent to the putative binding site of SOX11. All staining images were after “Max Intensity” z-stack projection. (A) SOX4 and ASCL1 show the top percentage of overlapping enhancers that contain putative binding sites with SOX11. (B) scRNA-seq analysis suggested that sox4a was expressed in progenitor clusters, while sox11a, sox11b, and ascl1a were expressed in ENS neuroblasts. (C) At 3 dpf, ascl1a had an overlapping expression with sox11a/b, especially with sox11b. The white dash box indicates the zoomed region on the right. Arrows indicate overlapping expression between ascl1a, sox11a and sox11b. (Scale bar, 100 μm, and 50 μm for the zoomed region.) (D) Representative image of embryo with near complete loss of HuC/D after ascl1a knockout. The dotted line indicates the outline of the gut (Nascl1a = 6, Ntyr = 6, replicates = 2). (Scale bar, 100 μm.) (E) Representative image of embryo with near complete loss of adcyap1b after ascl1a knockout. The dotted line indicates the outline of the gut. (Nascl1a = 6, Ntyr = 6, replicates = 2). (Scale bar, 100 μm.) (F) ASCL1 has a putative binding site in the putative enhancer of adcyap1b. A plasmid was generated with a mutated ASCL1 binding site. (G) Enhancers with mutated ASCL1 binding site showed a significant reduction in the percentage of positive GFP signal in ENS (ENS GFP, Nadc = 60, Nmut = 56, replicates = 4).