
- Title
-
Anti-Thrombotic Effects of Coprinus comatus Fibrinolytic Enzyme in Zebrafish
- Authors
- Jing, Y., Wang, J., He, Y., Liu, Z., Liu, X.
- Source
- Full text @ Nutrients

Determination of the maximum tolerated concentration of CFE. |
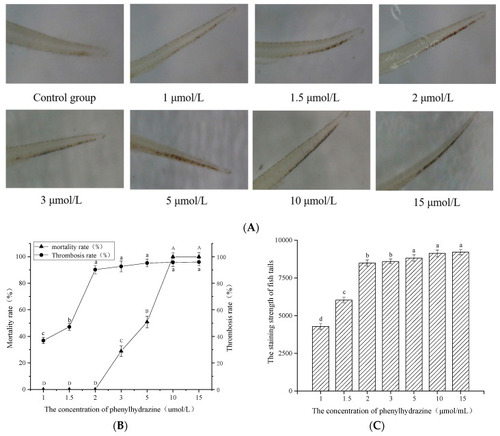
Construction of zebrafish phenylhydrazine-induced thrombus model. ( |
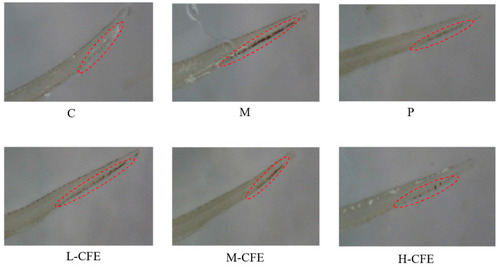
Microscopic observation of the zebrafish tails for each experimental group. C represents the Control group; M represents the Thrombus model group; P represents the Positive control group; L-CFE represents the Low-dose CFE group; M-CFE represents the Medium-dose CFE group; H-CFE represents the High-dose CFE group. The red circles highlight the differential erythrocyte aggregation patterns observed microscopically in the caudal region of zebrafish across the experimental groups. |
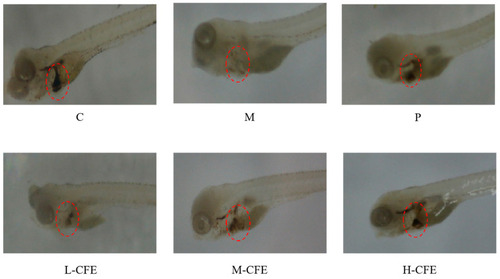
Microscopic observation of the zebrafish hearts from each experimental group. C represents the Control group; M represents the Thrombus model group; P represents the Positive control group; L-CFE represents the Low-dose CFE group; M-CFE represents the Medium-dose CFE group; and H-CFE represents the High-dose CFE group. The red circles highlight the differential erythrocyte aggregation patterns observed microscopically in the hearts of zebrafish across experimental groups. |
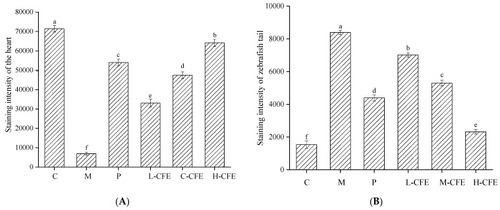
Analysis of staining intensity of zebrafish hearts and tails. ( |
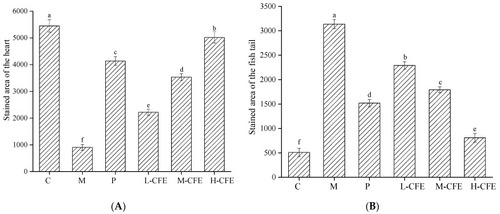
Analysis of heart and tail stained areas of zebrafish. ( |
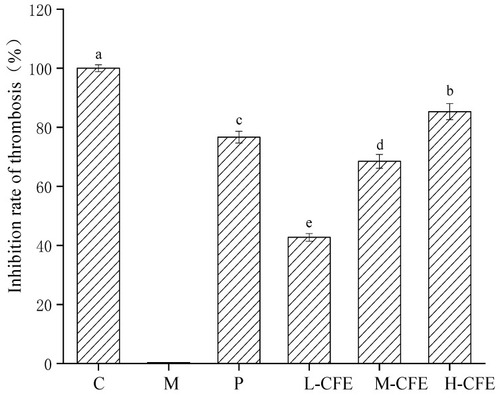
Effects of CFE on thrombus inhibition rate in zebrafish. C represents the Control group; M represents the Thrombus model group; P represents the Positive control group; L-CFE represents the Low-dose CFE group; M-CFE represents the Medium-dose CFE group; H-CFE represents the High-dose CFE group. Different lowercase letters indicate statistically significant differences between groups ( |
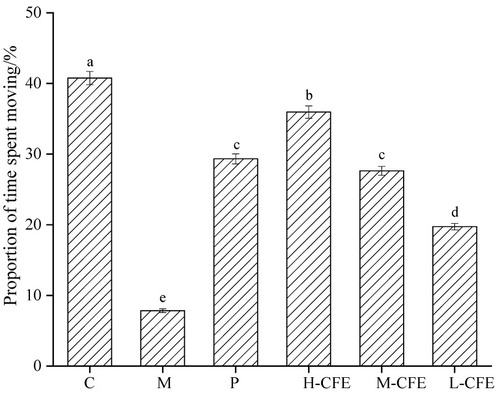
Effects of CFE on the proportion of time spent moving by zebrafish. C represents the Control group; M represents the Thrombus model group; P represents the Positive control group; L-CFE represents the Low-dose CFE group; M-CFE represents the Medium-dose CFE group; H-CFE represents the High-dose CFE group. Different lowercase letters indicated statistically significant differences between groups ( |
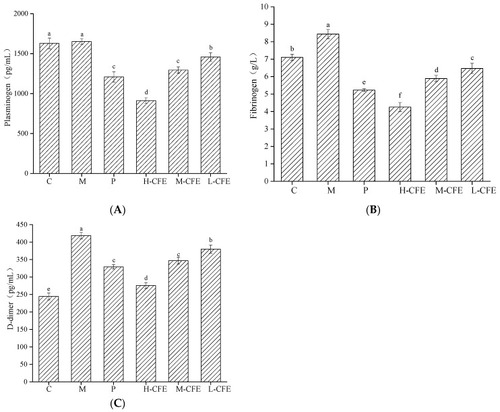
Fibrinolysis-promoting effect of CFE on zebrafish. ( |
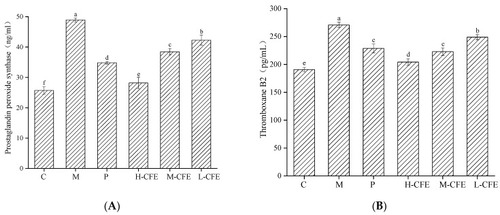
Anti-platelet activation of CFE in zebrafish. ( |
Anti-platelet activation of CFE in zebrafish. ( |
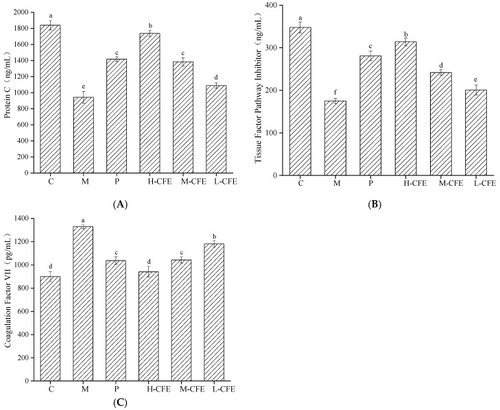
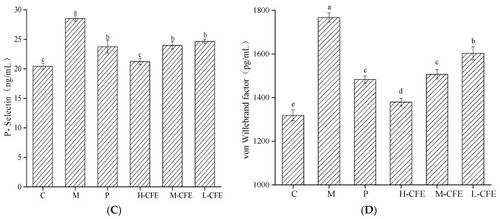
Anticoagulation effect of CFE on zebrafish. ( |