
FIGURE
Figure 3
Figure 3
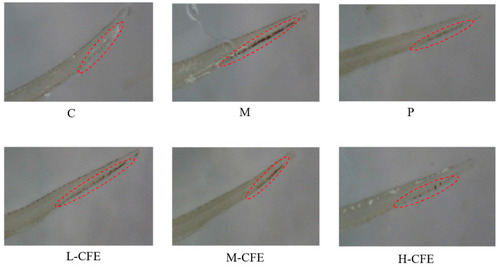
Microscopic observation of the zebrafish tails for each experimental group. C represents the Control group; M represents the Thrombus model group; P represents the Positive control group; L-CFE represents the Low-dose CFE group; M-CFE represents the Medium-dose CFE group; H-CFE represents the High-dose CFE group. The red circles highlight the differential erythrocyte aggregation patterns observed microscopically in the caudal region of zebrafish across the experimental groups. |
Expression Data
Expression Detail
Antibody Labeling
Phenotype Data
Phenotype Detail
Acknowledgments
This image is the copyrighted work of the attributed author or publisher, and
ZFIN has permission only to display this image to its users.
Additional permissions should be obtained from the applicable author or publisher of the image.
Full text @ Nutrients