
FIGURE
Figure 7
Figure 7
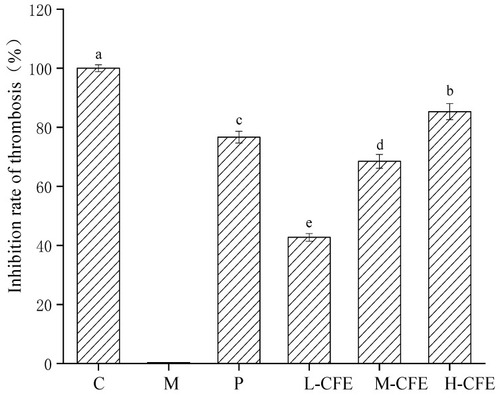
Effects of CFE on thrombus inhibition rate in zebrafish. C represents the Control group; M represents the Thrombus model group; P represents the Positive control group; L-CFE represents the Low-dose CFE group; M-CFE represents the Medium-dose CFE group; H-CFE represents the High-dose CFE group. Different lowercase letters indicate statistically significant differences between groups ( |
Expression Data
Expression Detail
Antibody Labeling
Phenotype Data
Phenotype Detail
Acknowledgments
This image is the copyrighted work of the attributed author or publisher, and
ZFIN has permission only to display this image to its users.
Additional permissions should be obtained from the applicable author or publisher of the image.
Full text @ Nutrients