ICER protein expression in zebrafish tissues. (A) Western blot analysis of protein expression in melanomas from the indicated zebrafish strains. Tissue samples were collected from skin and tumor tissues as shown. Western blotting for endogenous ICER expression was performed from whole tissue extracts using anti-ICER polyclonal antibodies (Cirinelli et al., 2022). The same membrane was stripped and re-probed with anti-α-Tubulin antibodies as a loading control (bottom panel). The left margin indicates the relative mobility of low range molecular weight markers from Bio-Rad (in kDa). The right margin indicates the relative mobility of ICER and α-Tubulin. Asterisks denote post-translationally modified forms of ICER (Mémin et al., 2011; Cirinelli et al., 2022). (B) Western blot analysis of FACS-sorted mitfa+ skin cells isolated from mitfa:mCherry+; crestin:EGFP+; tyrosinase/ zebrafish at 6 and 14 months post fertilization. Skin tissue was manually dissected, enzymatically dissociated, and filtered to generate a single-cell suspension. Live mitfa+ cells (DRAQ7, mCherry+) were isolated via FACS. These mitfa+ skin cells include a mixed population primarily consisting of melanocytes and xanthophores. A total of 98,000 sorted cells pooled from 5–7 zebrafish were lysed in RIPA buffer supplemented with protease inhibitors. Lysates were clarified and subjected to western blotting as described in (A). ICER protein was not reduced in the tumor derived cells. While the absence of detectable protein may reflect post-transcriptional instability or proteasomal degradation of ICER, the possibility of transcriptional downregulation cannot be excluded, as mRNA levels were not assessed in this experiment.

Survival Analysis. Kaplan–Meier survival curve comparing percent survival among three transgenic zebrafish cohorts: EGFP (n=37), wtICER (n=48), and S35-41A-ICER (n=40) over a 104-week observation period. Survival curves were generated using the Kaplan–Meier estimator, with survival differences assessed using the log-rank test (P<0.05). Fish expressing wtICER displayed significantly reduced survival compared to the EGFP control via pair-wise t-test, correlating with more aggressive tumor histology observed in Fig. 3. In contrast, fish expressing the S35-41A-ICER mutant showed improved survival compared to wtICER (P<0.05), consistent with reduced tumorigenesis.

Tumor histology and gross phenotypic analysis of transgenic zebrafish cohorts expressing EGFP, wtICER, and S35-41A-ICER. Representative images of zebrafish and corresponding H&E-stained tumor sections for each cohort. From left: EGFP-expressing zebrafish exhibit melanomas localized to the skin and minimal infiltration into proximal muscle tissue. Middle: wtICER-expressing zebrafish display extensive tumor growth with pronounced infiltration into the underlying muscle, indicative of an aggressive melanoma phenotype. Right: S35-41A-ICER expressing zebrafish shows some cellularity, though presents distinctly from the other samples. Gross phenotypic analysis mirrors these histological findings, with fish expressing EGFP showing moderate tumor size, wtICER fish exhibiting large, and widespread tumors, and S35-41A-ICER fish displaying smaller lesions. While the exact type of tumor was not able to be confirmed, it is believed to be melanoma. Scale bar: 70 µm.

Characterization of established cell lines from fish melanomas. (A) Images of brightfield and fluorescence microscopy of MiniCoopR-EGFP (446A) and MiniCoopR-HA-wt-ICER (447A) cell lines in culture. (B) PCR analysis of 446A and 447A cell lines to test for HA-ICER transgene integration into the fish genome. (C) Anti-HA Western blot analysis of 446A and 447A cell lines to test for transgenic HA-ICER protein expression. 446A was used as a control. (D) Immunocytochemical determination of the subcellular localization of the transgenic HA-ICER protein in 447A cell line. 446A was used as a control, showing no signal (not shown). Commercially available anti-HA antibodies were used in the experiment shown in C and D, and anti-αTubulin antibodies in C as loading control. Scale bar: 50 µm.

Gene expression comparison. Expression signature of wtICER (n=3) and EGFP (n=3) of relevant genes involved in (A) Glycosaminoglycan biosynthesis of keratan sulfate. (B) Genes related to numerous tumor biology pathways, found to be differentially expression in this experiment. (C) Genes found to be differentially expressed, based on DAVID query of possible ICER regulatory genes via GO, found to be involved in melanogenesis. Differential gene expression analysis was conducted via iDEP (version 2.0.1) with FDR ≤0.05, and log2 (fold-change) ≥2.

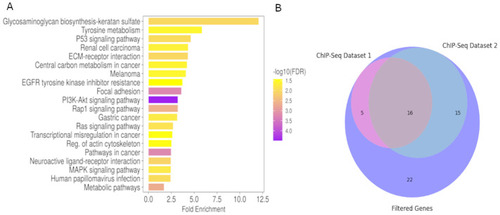
Pathway enrichment. (A) Bar chart of ShinyGO output of all DEG from the zebrafish tumor cell lines for EGFP (n=3) and wtICER (n=3). We note that Glycosaminoglycan biosynthesis of keratan sulfate, while the highest fold-enrichment, PI3K-Akt includes the lowest FDR, and includes many relevant genes involved in melanoma and other cancers including akt1, cdkn1a, col4a4, fgf5, fgfr2, met, pdgfra, pdgfrb. (B) Venn diagram illustrating the overlap of genes identified through analyses of ICER's transcriptional mechanisms. Total filtered list of 58 zebrafish and orthologous Human genes that were upregulated in wtICER, but downregulated in EGFP and phosphorylation mutant, and also contain CRE motifs in the promoter regions; 16 total genes overlap between 2 ChIP-Seq experiments from ENCODE (crema, zcchc24, prkacaa, iqsec1b, rgs12b, sik2b, gli2a, gab1, ttyh3b, gyg1b, zbtb16b, actn4, junba, plxdc2, plpp3, and hmga2).

Proposed Model of PRKACA regulation via ICER. Proposed model showing how wtICER (left) and the phosphorylation deficient S35-41-ICER (right) may impact gene expression, and specifically PRKACA, encoding the alpha catalytic subunit of PKA. Following adenylyl cyclase conversion of ATP to cAMP, 2 cAMP molecules bind to each PKA regulatory subunit, releasing the now active catalytic subunits, which phosphorylate CREB among other targets. Active CREB binds to CREs on the PRKACA promoter, upregulating gene expression of this subunit, which in turn, can more readily phosphorylate CREB in the presence of additional cAMP secondary messenger signal, forming a positive feedback loop. On the left, ICER is shown, in this case, to be phosphorylated on serine's 35 and 41, and subsequently ubiquitinated and removed to the cytosol. ICER in the example shown is not poly-ubiquitinated or degraded due to the presence of an HA-tag which prevents N-terminal recognition by UBR4. On the right, we show the phosphorylation deficient ICER is now unable to be phosphorylated, and therefore not ubiquitinated. In this environment, ICER competitively binds to CRE's on the promoter of many genes, including PRKACA and inhibits expression. In the case of PRKACA transcriptional repression by ICER, expression of the PKA catalytic subunit is decreased, decreasing the amount of phosphorylated and active CREB.

Acknowledgments
This image is the copyrighted work of the attributed author or publisher, and ZFIN has permission only to display this image to its users. Additional permissions should be obtained from the applicable author or publisher of the image. Full text @ Biol. Open