
- Title
-
Deep homology of a brachyury cis-regulatory syntax and the evolutionary origin of the notochord
- Authors
- Fan, T.P., Lee, J.R., Lin, C.Y., Chen, Y.C., Cutting, A.E., Cameron, R.A., Yu, J.K., Su, Y.H.
- Source
- Full text @ Sci Adv
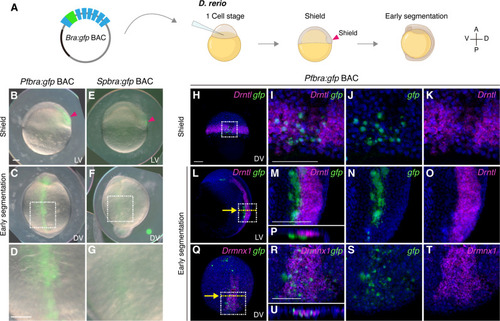
( |
( |
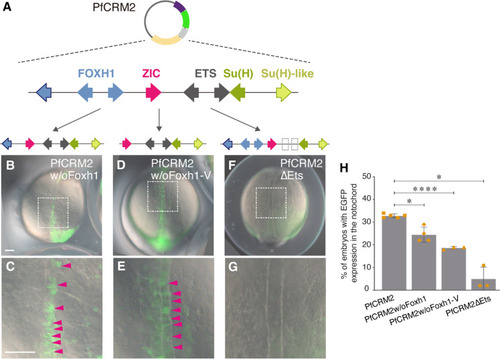
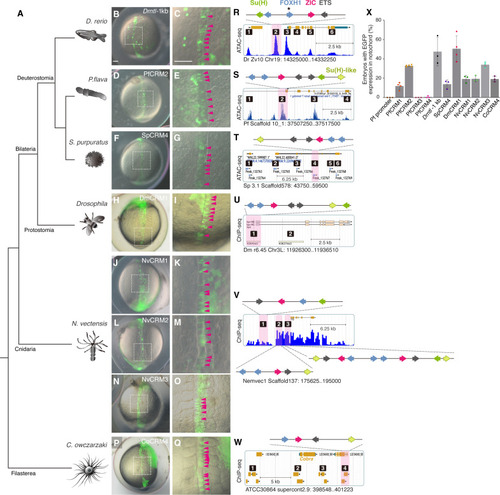
Foxh1 and Ets sites of the hemichordate SFZE syntax are functionally important for notochord activity. ( |
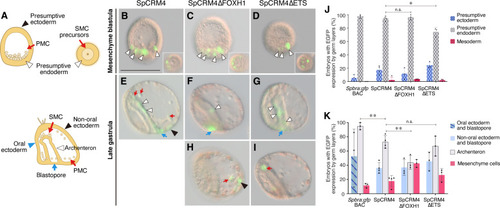
Foxh1 and Ets sites of the sea urchin SFZE syntax confer endodermal activity at different developmental stages. ( |
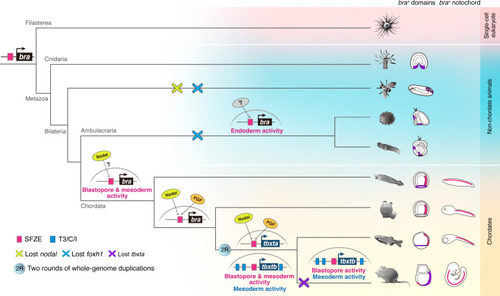
Proposed scenario of SFZE evolution and the origin of the notochord. The SFZE syntax (red rectangles) associated with |