|
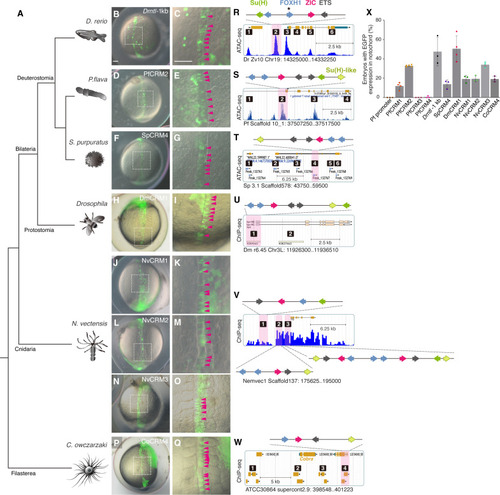
Brachyury CRMs with SFZE/SFZE-like syntax show activity in the zebrafish notochord. (A) Phylogenetic relationships of the analyzed species. (B to Q) Zebrafish embryos injected with SFZE/SFZE-like containing CRMs from zebrafish (Drntl-1kb), hemichordate (PfCRM2), sea urchin (SpCRM4), fruit fly (DmCRM1), sea anemone (NvCRM1, NvCRM2, and NvCRM3), and filasterea (CoCRM4). The right panels show magnified views of the notochord region (white dashed boxes in the corresponding left panels) with magenta arrowheads indicating enhanced GFP (EGFP) signals in the notochord cells. The left panels are in the same scale, as are the right panels. Scale bars in (B) and (C), 100 μm. (R to W) The putative CRMs based on published ATAC-seq (Drntl, Pfbra, and Spbra loci) and chromatin immunoprecipitation sequencing (ChIP-seq) datasets (Dmbyn, H3K4me1, and H3K27me3; Nvbra, H3K4me1; Cobra, H3K4me1, and H3K4me3). Potential CRMs are indicated with numbers, and CRMs carrying SFZE/SFZE-like motifs are shaded in pink. The TF binding sites are denoted schematically with colored arrows placed on top of each diagram to show the orientation and order. Colors of TF sites are shown in (R) and (S). Genome versions, scaffold/chromosome numbers, and positions of the genomic loci displayed in (R) to (W) are indicated below the respective panel. The samples used for generating of the ATAC-seq and ChIP-seq datasets are listed in table S7. (X) Percentages of embryos with EGFP signals in the notochord out of EGFP-positive embryos. Each colored square represents the result of one experiment. Gray columns represent the average of at least three biological replicates, with error bars serving as SDs.
|