IMAGE

Fig. 4.

ID
ZDB-IMAGE-250730-44
Source
Figures for Fan et al., 2025
Image
Figure Caption

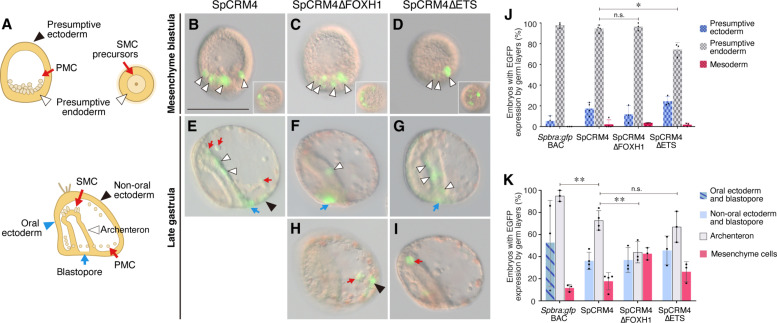
Fig. 4. Foxh1 and Ets sites of the sea urchin SFZE syntax confer endodermal activity at different developmental stages.

(A) Illustrations of sea urchin embryos at the mesenchyme blastula (top left, lateral view; top right, vegetal view) and late gastrula (bottom) stages. Colored arrows and arrowheads mark different embryonic territories. (B to I) Representative EGFP-positive embryos showing reporter activities. Colored arrows and arrowheads indicate EGFP-positive cells within the territories shown in (A). Embryos are oriented as in (A). For late gastrulae, the ventral side is to the left. Insets in (B) to (D) are the vegetal view to show EGFP signals in the presumptive endoderm. delta symbol (△), mutation. Panels are all in the same scale [scale bar in (B) 100 μm]. (J and K) Percentages of mesenchyme blastula (J) and late gastrula (K) embryos showing EGFP signals in the indicated territories. PMC, primary mesenchyme cells; SMC, secondary mesenchyme cells. *P < 0.05; **P < 0.01; n.s., not significant.

Acknowledgments
This image is the copyrighted work of the attributed author or publisher, and ZFIN has permission only to display this image to its users. Additional permissions should be obtained from the applicable author or publisher of the image. Full text @ Sci Adv