
- Title
-
Assessment of a novel color vision optomotor response assay in zebrafish larvae with red cone ablation
- Authors
- Eom, Y., Koh, E., Park, H.S., Park, H.C., Song, J.S., Boatright, J.H., Nickerson, J.M., Kim, S.
- Source
- Full text @ Lab Anim (NY)
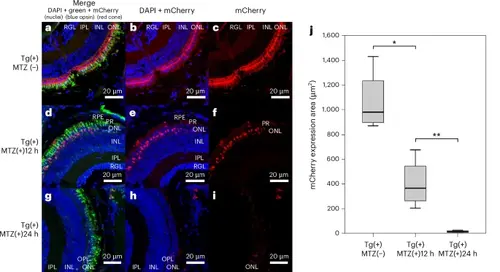
Comparison of immunofluorescence staining and mCherry expression areas among the three experimental groups: Tg(+)MTZ(−), Tg(+)MTZ(+)12 h and Tg(+)MTZ(+)24 h. a–i, Immunofluorescence images of DAPI (blue), blue opsin (green), mCherry (red opsin (red)) and merged photos for the comparison of mCherry expression among the three groups. Larvae in all three groups were 6-day-old Tg (thrb:gal4;UAS:epNTR-p2a-mCherry) zebrafish. The Tg(+)MTZ(−) group (n = 4) did not receive 5 mM MTZ treatment (a, merge; b, DAPI + mCherry; and c, mCherry alone). The Tg(+)MTZ(+)12 h group (n = 4) was submerged in water containing 5 mM MTZ for 12 h at 5 dpf to ablate red cones (d, merge; e, DAPI + mCherry; and f, mCherry alone). The Tg(+)MTZ(+)24 h group (n = 4) was submerged in water containing 5 mM MTZ for 24 h at 5 dpf to ablate red cones (g, merge; h, DAPI + mCherry; and i, mCherry alone). j, Quantification of mCherry expression area revealed significant differences in mean (±standard deviation) between groups (1,066.6 ± 252.2, 404.1 ± 200.9 and 16.5 ± 7.6 μm2 for Tg(+)MTZ(−), Tg(+)MTZ(+)12 h and Tg(+)MTZ(+)24 h, respectively; P < 0.001) using one-way ANOVA and post-hoc Tukey HSD test: *P = 0.002 and **P = 0.039. The error bars represent the standard deviation. INL, inner nuclear layer; IPL, inner plexiform layer; ONL, outer nuclear layer; OPL, outer plexiform layer; PR, photoreceptor; RPE, retinal pigmented epithelium; RGL, retinal ganglion cell layer. |
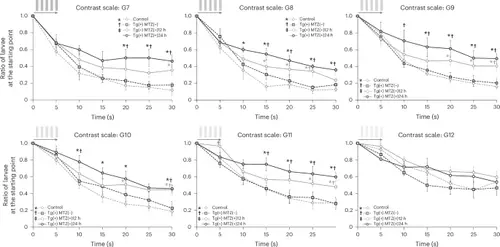
Comparison of the ratio of larvae at the starting point of the response curve in the C-OMR assay after red cone ablation at 5 dpf among four groups: control, Tg(+)MTZ(−), Tg(+)MTZ(+)12 h and Tg(+)MTZ(+)24 h.Six-day-old wild-type zebrafish larvae were used as the control group (n = 120). Six-day-old Tg (thrb:gal4;UAS:epNTR-p2a-mCherry) zebrafish larvae were used in Tg(+)MTZ(−), Tg(+)MTZ(+)12 h and Tg(+)MTZ(+)24 h groups (n = 120 for each group). The Tg(+)MTZ(−) group did not receive 5 mM MTZ treatment. Tg(+)MTZ(+)12 h and Tg(+)MTZ(+)24 h groups were submerged in water containing 5 mM MTZ for 12 h and 24 h, respectively, at 5 dpf to ablate red cones. For each C-OMR assay, 20 zebrafish larvae per group were used, and the assay was repeated six times with different larvae. Reported values represent the average of the six experiments. The RGB color values in hexadecimal for gray stripes from G7 to G13 were #ADADAD, #C0C0C0, # D0D0D0, #DDDDDD, #E5E5E5, #EEEEEE and #F4F4F4, respectively. Asterisks signify a P value <0.05 compared with the control group; daggers denote a P value <0.05 compared with the Tg(+)MTZ(−) group; and a double dagger highlights a P value <0.05 relative to the Tg(+)MTZ(+)12 h group, as assessed by one-way ANOVA with a post-hoc Tukey HSD test. The error bars represent the standard deviation. |
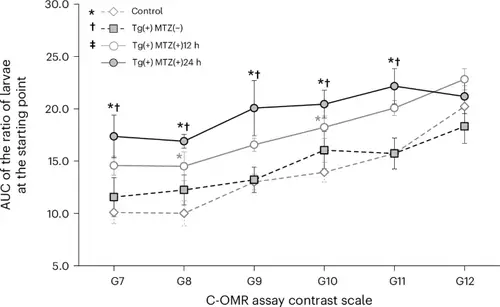
Comparison of the AUC representing the ratio of larvae at the starting point as determined by the C-OMR assay after red cone ablation at 5 dpf among four groups: control, Tg(+)MTZ(−), Tg(+)MTZ(+)12 h and Tg(+)MTZ(+)24 h. Six-day-old wild-type zebrafish larvae were used as the control group (n = 120). Six-day-old Tg (thrb:gal4;UAS:epNTR-p2a-mCherry) zebrafish larvae were used in Tg(+)MTZ(−), Tg(+)MTZ(+)12 h and Tg(+)MTZ(+)24 h groups (n = 120 for each group). The Tg(+)MTZ(−) group did not receive 5 mM MTZ treatment. Tg(+)MTZ(+)12 h and Tg(+)MTZ(+)24 h groups were submerged in water containing 5 mM MTZ for 12 h and 24 h, respectively, at 5 dpf to ablate red cones. For each C-OMR assay, 20 zebrafish larvae per group were used, and the assay was repeated six times with different larvae. Reported values represent the average of the six experiments. The RGB color values in hexadecimal for gray stripes from G7 to G13 were #ADADAD, #C0C0C0, # D0D0D0, #DDDDDD, #E5E5E5, #EEEEEE and #F4F4F4, respectively. Asterisks signify a P value <0.05 compared with the control group; daggers denote a P value <0.05 compared with the Tg(+)MTZ(−) group; and a double dagger highlights a P value <0.05 relative to the Tg(+)MTZ(+)12 h group, as assessed by one-way ANOVA with a post-hoc Tukey HSD test. The error bars represent the standard deviation. |
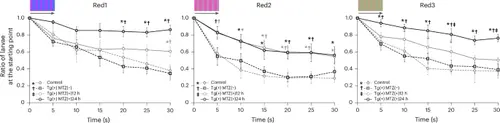
Comparison of the ratio of larvae at the starting point of the response curve in the CV-OMR assay using Red1, Red2 and Red3 stripes after red cone ablation at 5 dpf among four groups: control, Tg(+)MTZ(−), Tg(+)MTZ(+)12 h and Tg(+)MTZ(+)24 h. Six-day-old wild-type zebrafish larvae were used as the control group (n = 120). Six-day-old Tg (thrb:gal4;UAS:epNTR-p2a-mCherry) zebrafish larvae were used in Tg(+)MTZ(−), Tg(+)MTZ(+)12 h and Tg(+)MTZ(+)24 h groups (n = 120 for each group). The Tg(+)MTZ(−) group did not receive 5 mM MTZ treatment. Tg(+)MTZ(+)12 h and Tg(+)MTZ(+)24 h groups were submerged in water containing 5 mM MTZ for 12 h and 24 h, respectively, at 5 dpf to ablate red cones. For each C-OMR assay, 20 zebrafish larvae per group were used, and the assay was repeated six times with different larvae. Reported values represent the average of the six experiments. The RGB color values in hexadecimal were #C535FF and #3679FF for the two-colored stripes of Red1, #EB57B9 and #BB87B9 for Red2 and #BF9F86 and #9BB085 for Red3. Asterisks signify a P value <0.05 compared with the control group; daggers denote a P value <0.05 compared with the Tg(+)MTZ(−) group; and a double dagger indicates a P value <0.05 relative to the Tg(+)MTZ(+)12 h group, as assessed by one-way ANOVA with a post-hoc Tukey HSD test. The error bars represent the standard deviation. |
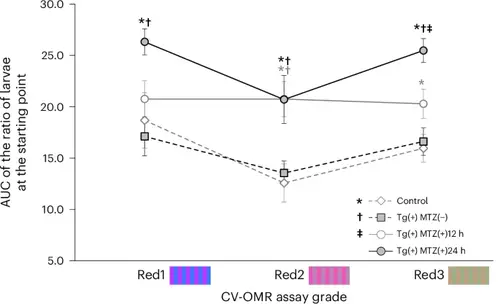
Comparison of the AUC representing the ratio of larvae at the starting point as determined by the CV-OMR assay using Red1, Red2 and Red3 stripes after red cone ablation at 5 dpf among four groups: control, Tg(+)MTZ(−), Tg(+)MTZ(+)12 h and Tg(+)MTZ(+)24 h. Six-day-old wild-type zebrafish larvae were used as the control group (n = 120). Six-day-old Tg (thrb:gal4;UAS:epNTR-p2a-mCherry) zebrafish larvae were used in Tg(+)MTZ(−), Tg(+)MTZ(+)12 h and Tg(+)MTZ(+)24 h groups (n = 120 for each group). Tg(+)MTZ(+)12 h and Tg(+)MTZ(+)24 h groups were submerged in water containing 5 mM MTZ for 12 h and 24 h, respectively, at 5 dpf to ablate red cones. For each C-OMR assay, 20 zebrafish larvae per group were used, and the assay was repeated six times with different larvae. Reported values represent the average of the six experiments. The RGB color values in hexadecimal were #C535FF and #3679FF for the two-colored stripes of Red1, #EB57B9 and #BB87B9 for Red2 and #BF9F86 and #9BB085 for Red3. Asterisks represent a P value <0.05 compared with the control group; daggers denote a P value <0.05 compared with the Tg(+)MTZ(−) group; and a double dagger signifies a P value <0.05 compared with the Tg(+)MTZ(+)12 h group, as determined by one-way ANOVA with a post-hoc Tukey HSD test. The error bars represent the standard deviation |
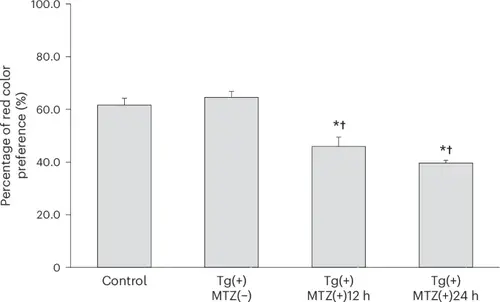
Comparison of red color preference percentage among four groups: control, Tg(+)MTZ(−), Tg(+)MTZ(+)12 h and Tg(+)MTZ(+)24 h. Six-day-old wild-type zebrafish larvae were used as the control group (n = 120). Six-day-old Tg (thrb:gal4;UAS:epNTR-p2a-mCherry) zebrafish larvae were used in Tg(+)MTZ(−), Tg(+)MTZ(+)12 h and Tg(+)MTZ(+)24 h groups (n = 120 for each group). The Tg(+)MTZ(−) group did not receive 5 mM MTZ treatment. Tg(+)MTZ(+)12 h and Tg(+)MTZ(+)24 h groups were submerged in water containing 5 mM MTZ for 12 h and 24 h, respectively, at 5 dpf to ablate red cones. For each red color preference test, 20 zebrafish larvae per group were used, and the test was repeated six times with different larvae. The mean percentage of red color preference (±standard deviation) of control, Tg(+)MTZ(−), Tg(+)MTZ(+)12 h and Tg(+)MTZ(+)24 h groups was 61.6% ± 5.1%, 64.6% ± 4.4%, 45.9% ± 7.1% and 39.6% ± 2.0%, respectively. Asterisks represent a P value <0.05 compared with the control group and daggers denote a P value <0.05 compared with the Tg(+)MTZ(−) group as determined by one-way ANOVA with a post-hoc Tukey HSD test. The error bars represent the standard deviation. |