
|
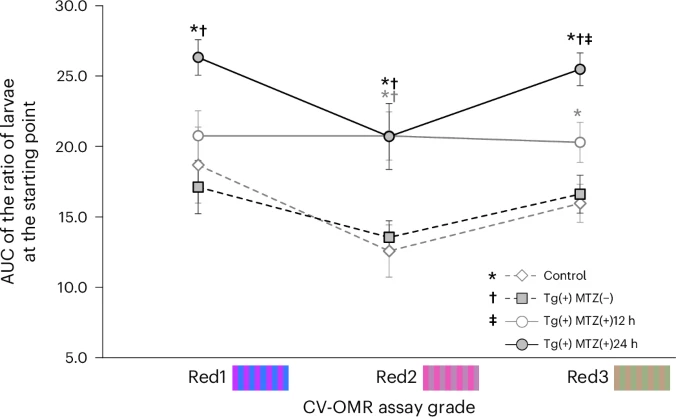
Fig. 5 Comparison of the AUC representing the ratio of larvae at the starting point as determined by the CV-OMR assay using Red1, Red2 and Red3 stripes after red cone ablation at 5 dpf among four groups: control, Tg(+)MTZ(−), Tg(+)MTZ(+)12 h and Tg(+)MTZ(+)24 h. Six-day-old wild-type zebrafish larvae were used as the control group (n = 120). Six-day-old Tg (thrb:gal4;UAS:epNTR-p2a-mCherry) zebrafish larvae were used in Tg(+)MTZ(−), Tg(+)MTZ(+)12 h and Tg(+)MTZ(+)24 h groups (n = 120 for each group). Tg(+)MTZ(+)12 h and Tg(+)MTZ(+)24 h groups were submerged in water containing 5 mM MTZ for 12 h and 24 h, respectively, at 5 dpf to ablate red cones. For each C-OMR assay, 20 zebrafish larvae per group were used, and the assay was repeated six times with different larvae. Reported values represent the average of the six experiments. The RGB color values in hexadecimal were #C535FF and #3679FF for the two-colored stripes of Red1, #EB57B9 and #BB87B9 for Red2 and #BF9F86 and #9BB085 for Red3. Asterisks represent a P value <0.05 compared with the control group; daggers denote a P value <0.05 compared with the Tg(+)MTZ(−) group; and a double dagger signifies a P value <0.05 compared with the Tg(+)MTZ(+)12 h group, as determined by one-way ANOVA with a post-hoc Tukey HSD test. The error bars represent the standard deviation