
|
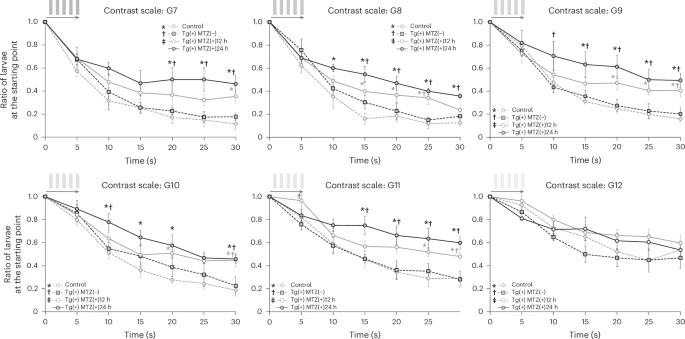
Fig. 2 Comparison of the ratio of larvae at the starting point of the response curve in the C-OMR assay after red cone ablation at 5 dpf among four groups: control, Tg(+)MTZ(−), Tg(+)MTZ(+)12 h and Tg(+)MTZ(+)24 h.Six-day-old wild-type zebrafish larvae were used as the control group (n = 120). Six-day-old Tg (thrb:gal4;UAS:epNTR-p2a-mCherry) zebrafish larvae were used in Tg(+)MTZ(−), Tg(+)MTZ(+)12 h and Tg(+)MTZ(+)24 h groups (n = 120 for each group). The Tg(+)MTZ(−) group did not receive 5 mM MTZ treatment. Tg(+)MTZ(+)12 h and Tg(+)MTZ(+)24 h groups were submerged in water containing 5 mM MTZ for 12 h and 24 h, respectively, at 5 dpf to ablate red cones. For each C-OMR assay, 20 zebrafish larvae per group were used, and the assay was repeated six times with different larvae. Reported values represent the average of the six experiments. The RGB color values in hexadecimal for gray stripes from G7 to G13 were #ADADAD, #C0C0C0, # D0D0D0, #DDDDDD, #E5E5E5, #EEEEEE and #F4F4F4, respectively. Asterisks signify a P value <0.05 compared with the control group; daggers denote a P value <0.05 compared with the Tg(+)MTZ(−) group; and a double dagger highlights a P value <0.05 relative to the Tg(+)MTZ(+)12 h group, as assessed by one-way ANOVA with a post-hoc Tukey HSD test. The error bars represent the standard deviation.