
Fig. 6
- ID
- ZDB-FIG-250825-39
- Publication
- Eom et al., 2025 - Assessment of a novel color vision optomotor response assay in zebrafish larvae with red cone ablation
- Other Figures
- All Figure Page
- Back to All Figure Page
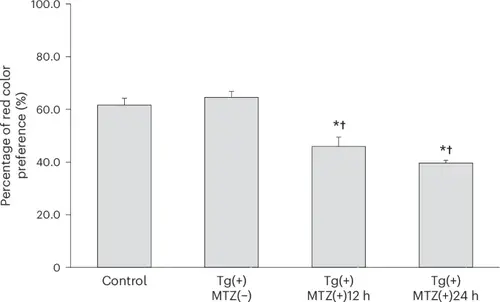
Comparison of red color preference percentage among four groups: control, Tg(+)MTZ(−), Tg(+)MTZ(+)12 h and Tg(+)MTZ(+)24 h. Six-day-old wild-type zebrafish larvae were used as the control group (n = 120). Six-day-old Tg (thrb:gal4;UAS:epNTR-p2a-mCherry) zebrafish larvae were used in Tg(+)MTZ(−), Tg(+)MTZ(+)12 h and Tg(+)MTZ(+)24 h groups (n = 120 for each group). The Tg(+)MTZ(−) group did not receive 5 mM MTZ treatment. Tg(+)MTZ(+)12 h and Tg(+)MTZ(+)24 h groups were submerged in water containing 5 mM MTZ for 12 h and 24 h, respectively, at 5 dpf to ablate red cones. For each red color preference test, 20 zebrafish larvae per group were used, and the test was repeated six times with different larvae. The mean percentage of red color preference (±standard deviation) of control, Tg(+)MTZ(−), Tg(+)MTZ(+)12 h and Tg(+)MTZ(+)24 h groups was 61.6% ± 5.1%, 64.6% ± 4.4%, 45.9% ± 7.1% and 39.6% ± 2.0%, respectively. Asterisks represent a P value <0.05 compared with the control group and daggers denote a P value <0.05 compared with the Tg(+)MTZ(−) group as determined by one-way ANOVA with a post-hoc Tukey HSD test. The error bars represent the standard deviation. |