
Fig. 1
- ID
- ZDB-FIG-250825-34
- Publication
- Eom et al., 2025 - Assessment of a novel color vision optomotor response assay in zebrafish larvae with red cone ablation
- Other Figures
- All Figure Page
- Back to All Figure Page
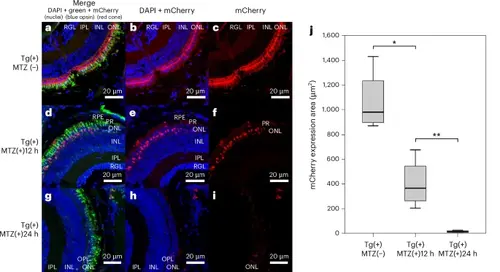
Comparison of immunofluorescence staining and mCherry expression areas among the three experimental groups: Tg(+)MTZ(−), Tg(+)MTZ(+)12 h and Tg(+)MTZ(+)24 h. a–i, Immunofluorescence images of DAPI (blue), blue opsin (green), mCherry (red opsin (red)) and merged photos for the comparison of mCherry expression among the three groups. Larvae in all three groups were 6-day-old Tg (thrb:gal4;UAS:epNTR-p2a-mCherry) zebrafish. The Tg(+)MTZ(−) group (n = 4) did not receive 5 mM MTZ treatment (a, merge; b, DAPI + mCherry; and c, mCherry alone). The Tg(+)MTZ(+)12 h group (n = 4) was submerged in water containing 5 mM MTZ for 12 h at 5 dpf to ablate red cones (d, merge; e, DAPI + mCherry; and f, mCherry alone). The Tg(+)MTZ(+)24 h group (n = 4) was submerged in water containing 5 mM MTZ for 24 h at 5 dpf to ablate red cones (g, merge; h, DAPI + mCherry; and i, mCherry alone). j, Quantification of mCherry expression area revealed significant differences in mean (±standard deviation) between groups (1,066.6 ± 252.2, 404.1 ± 200.9 and 16.5 ± 7.6 μm2 for Tg(+)MTZ(−), Tg(+)MTZ(+)12 h and Tg(+)MTZ(+)24 h, respectively; P < 0.001) using one-way ANOVA and post-hoc Tukey HSD test: *P = 0.002 and **P = 0.039. The error bars represent the standard deviation. INL, inner nuclear layer; IPL, inner plexiform layer; ONL, outer nuclear layer; OPL, outer plexiform layer; PR, photoreceptor; RPE, retinal pigmented epithelium; RGL, retinal ganglion cell layer. |