FIGURE SUMMARY
Title

Phenotype to genotype: A new and rapid approach using whole-genome sequencing

Authors
Feltes, M., Zimin, A.V., Angel, S., Pansari, N., Hensley, M.R., Anderson, J.L., Shen, M.C., Klemek, M., Shen, Y., Ginde, V.S., Kozan, H., Le, N.V., Truong, V.P., Wilson, M.H., Salzberg, S.L., Farber, S.A.
Source
Full text @ PLoS Genet.

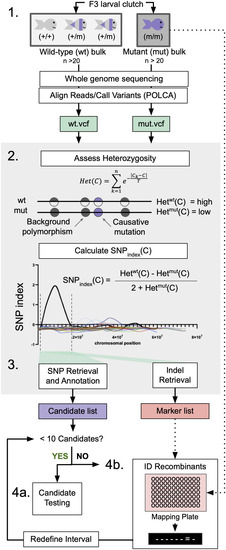
WheresWalker pipeline utilizes WGS data to identify segregating SNPs and indels.

1. Bulk Segregant Analysis: animals are sorted by phenotype and pooled to generate wild-type (wt) and mutant (mut) genomic DNA for whole-genome sequencing. Sequencing data is aligned and evaluated for variance using POLCA which outputs VCF files for wt and mut samples. gDNA for additional mutant animals can be saved for downstream analyses. 2. Heterozygosity is calculated in a sliding window across wt and mut genomes, where C is the coordinate at the center of each 10,000 bp window. These values are used to calculate the SNP index in order to define a homozygous interval; dashed lines indicate interval bounds. 3. Whereswalker extracts SNPs and indels that segregate appropriately with the mutant phenotype to generate a list of candidate SNPs and a list of indel markers. Steps 2 and 3 are executed in a single command by the WheresWalker script. 4a. If sufficiently few candidates have been identified, the genes can be targeted with CRISPR/Cas9. 4b. If the number of targets is intractable, the interval can be refined by identifying recombinants. This can be repeated until a sufficiently short candidate list has been generated.

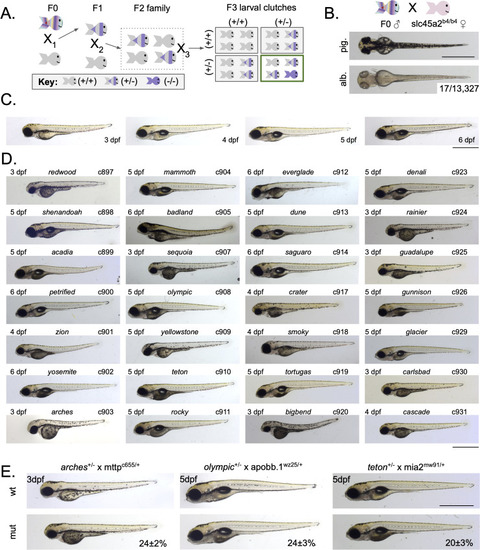
Forward genetic screen identifies 28 dark yolk mutants.

A) Generation of mutant families using a standard forward genetic F3 screening scheme. B) Single locus hit rate for the slc45a2 locus was determined by crossing male founders to slc45a2b4/b4 females and screening for albinism in the offspring; representative pigmented (pig.) and albino (alb.) 3 days post-fertilization (dpf) larvae are shown. C) Representative images of wild-type (wt) zebrafish from 3-6 dpf. D) Representative images of identified mutants; age, mutant name, and allele ID (cXXX) are noted. E) Screen mutants were crossed to known dark yolk mutants so that progeny could be evaluated for dark yolk. Representative images for 3 mutants that fail to complement known dark yolk loci. Phenotype frequency is reported as mean ± standard deviation. For arches: N = 4 clutches, n = 375 animals; For olympic: N = 5 clutches, n = 443 animals; For teton: N = 4 clutches, n = 396 animals. For all panels, scale bar represents 1 mm.

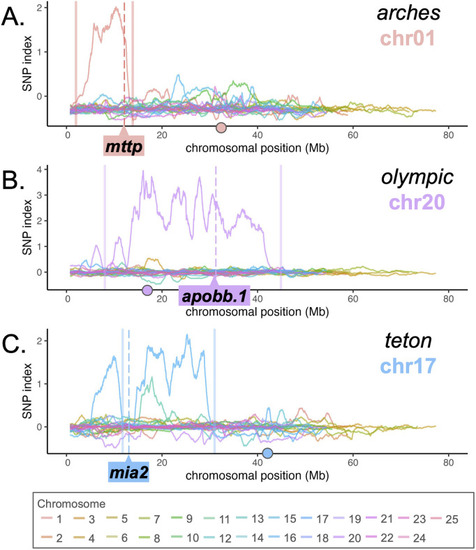
WheresWalker identifies the correct chromosomal region for three dark yolk loci.

Profile of SNP index across all chromosomes for arches (A) olympic (B) and teton (C) mutants. Solid lines indicate left and right bounds of the interval selected by WheresWalker, dashed lines indicate the position of the causative locus. Circles on the x axis indicate the approximate position of the centromere.

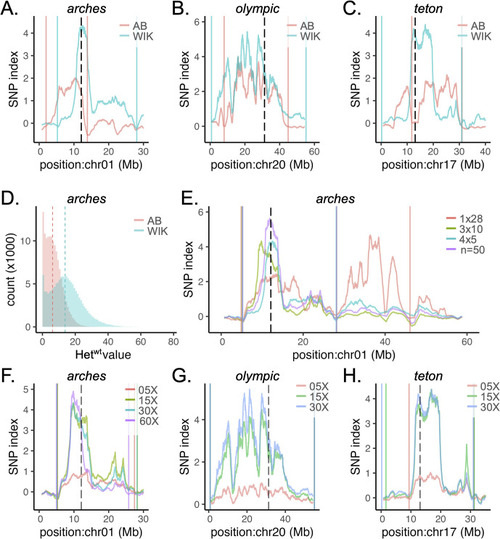
Background heterogeneity and sequencing depth improve WheresWalker SNPindex.

A-C) regional SNP index profile for datasets generated in an AB or WIK background for arches (A), olympic (B), and teton (C) mutants. D) Hetwt distribution for arches AB 4x5 and WIK 4x5 datasets. Binwidth is 1. Dashed lines mark the median (AB: 6.163692, WIK: 13.81362). E) Regional SNP index for arches datasets generated from different combinations of clutches: 1x28, 3x10, or 4x5 (clutch x animals per clutch). The n = 50 dataset was generated by combining 15X coverage datasets from the 3x10 and 4x5 datasets to generate a 30X dataset representing 50 animals from 4 clutches. F-H) Regional SNP index profile for the arches WIK, 3x10 (F), olympic WIK (G), and teton WIK (H) datasets with sequencing coverage simulated at 05X, 15X, or 30X. For arches WIK, 3x10, additional reads were collected from the original sample to generate an ~ 60X dataset. For SNP index plots, solid lines indicate left and right bounds of the interval selected by WheresWalker, dashed lines indicate the position of the causative locus.

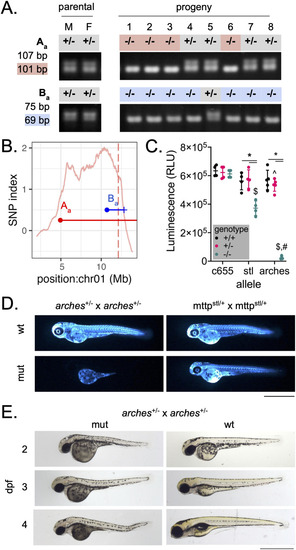
Recombinant mapping narrows region of interest to identify a loss-of-function allele of mttp.

A) markers Aa and Ba were outputted by WheresWalker and used to genotype arches mutants in order to identify recombinants. M and F denote male and female parents, respectively. PCR product sizes for wild-type and mutant (highlighted) products are as indicated. B) Points representing Aa (red) and Ba (blue) marker locations and horizontal lines representing the estimated distance to the causative mutation are overlaid on the SNP index for the arches interval (chromosome 1: 2.46-13.86 Mb). The vertical dashed line indicates the location of mttp, the causative locus. C) quantification of ApoBb.1-nanoluciferase levels at 3 dpf. Mean ± standard deviation, N = 4-5 clutches, n = 2-8 animals/datapoint. P < 0.05 by two-way ANOVA with Geisser-Greenhouse correction and Tukey’s multiple comparisons test. * vs. respective wild-type, ^ vs c655/ + , $ vs c655/c655, # vs stl/stl. D) Images of whole-animal ApoBb.1-nanoluciferase distribution in arches and stl mutants at 3 dpf. E) Brightfield images of mutant and wild-type animals from 2-4 dpf. For D and E, scale bar represents 1 mm.

slc3a2azion is a novel regulator of B-lp metabolism.

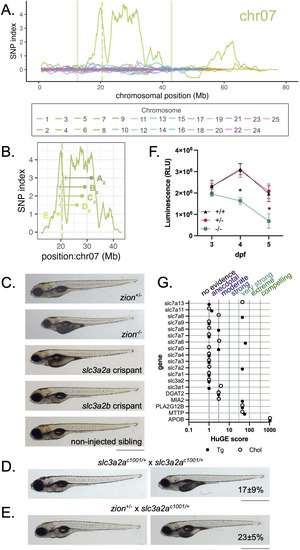
A) Elevated SNP index is observed on chromosome 7 in zion mutants; WheresWalker selected an interval from 19.03-26.02 Mb which was further analyzed. Solid vertical lines indicate interval bounds on chromosome 7. The vertical dashed line indicates the position of slc3a2a on chromosome 7. B) Mutant animals were genotyped for polymorphisms at 31609203 (Az), 29087847 (Bz), 28090051 (Cz), 26124850 (Dz), and 19034592 (Ez) bp to identify recombinants and predict the distance to the causative mutation. Points representing marker locations, and horizontal lines representing the estimated distance to mutation are overlaid on the SNP index for the interval. C) Representative images of larvae after editing at slc3a2a (dark yolk 41 ± 16%, N = 5, n = 248) and slc3a2b loci; non-injected larvae, as well as zion+/? and zion-/- siblings are shown for comparison. D) slc3a2ac1001/+ in-cross generates larvae with the dark yolk phenotype; dark yolk frequency is shown as mean ± standard deviation, N = 3, n = 876. E) slc3a2ac1001/+ crossed to zion+/- generates larvae with the dark yolk phenotype; dark yolk frequency is shown as mean ± standard deviation, N = 3, n = 299. For panels D-F, animals are 5 dpf, scale bar represents 1 mm. F) ApoBb.1-nanoluciferase quantification in zion mutants and siblings. Mean ± standard deviation, N = 3, n = 2–14, outliers were removed by the ROUT method (Q = 1%). P < 0.05 by two-way ANOVA with Geisser-Greenhouse correction and Tukey’s multiple comparisons test. * vs. + /- and +/ + . G) HuGE scores for SLC3 and SLC7 genes quantify the association of human variants with serum triglyceride (Tg) and total cholesterol (Chol). Genes with established links to B-lp synthesis are shown for comparison. HuGE association categories are noted on the top.

Acknowledgments
This image is the copyrighted work of the attributed author or publisher, and ZFIN has permission only to display this image to its users. Additional permissions should be obtained from the applicable author or publisher of the image. Full text @ PLoS Genet.