FIGURE

Fig 5

ID
ZDB-FIG-250722-29
Publication
Feltes et al., 2025 - Phenotype to genotype: A new and rapid approach using whole-genome sequencing
Other Figures
All Figure Page
Back to All Figure Page
Fig 5

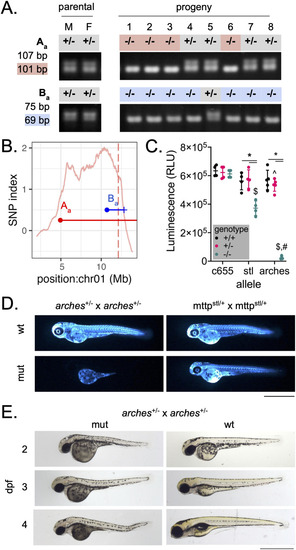
Recombinant mapping narrows region of interest to identify a loss-of-function allele of mttp.

A) markers Aa and Ba were outputted by WheresWalker and used to genotype arches mutants in order to identify recombinants. M and F denote male and female parents, respectively. PCR product sizes for wild-type and mutant (highlighted) products are as indicated. B) Points representing Aa (red) and Ba (blue) marker locations and horizontal lines representing the estimated distance to the causative mutation are overlaid on the SNP index for the arches interval (chromosome 1: 2.46-13.86 Mb). The vertical dashed line indicates the location of mttp, the causative locus. C) quantification of ApoBb.1-nanoluciferase levels at 3 dpf. Mean ± standard deviation, N = 4-5 clutches, n = 2-8 animals/datapoint. P < 0.05 by two-way ANOVA with Geisser-Greenhouse correction and Tukey’s multiple comparisons test. * vs. respective wild-type, ^ vs c655/ + , $ vs c655/c655, # vs stl/stl. D) Images of whole-animal ApoBb.1-nanoluciferase distribution in arches and stl mutants at 3 dpf. E) Brightfield images of mutant and wild-type animals from 2-4 dpf. For D and E, scale bar represents 1 mm.

Expression Data

Expression Detail
Antibody Labeling
Phenotype Data

Phenotype Detail
Acknowledgments
This image is the copyrighted work of the attributed author or publisher, and ZFIN has permission only to display this image to its users. Additional permissions should be obtained from the applicable author or publisher of the image. Full text @ PLoS Genet.