IMAGE

Fig 4

ID
ZDB-IMAGE-250722-29
Source
Figures for Feltes et al., 2025
Image
Figure Caption

Fig 4 Background heterogeneity and sequencing depth improve WheresWalker SNPindex.

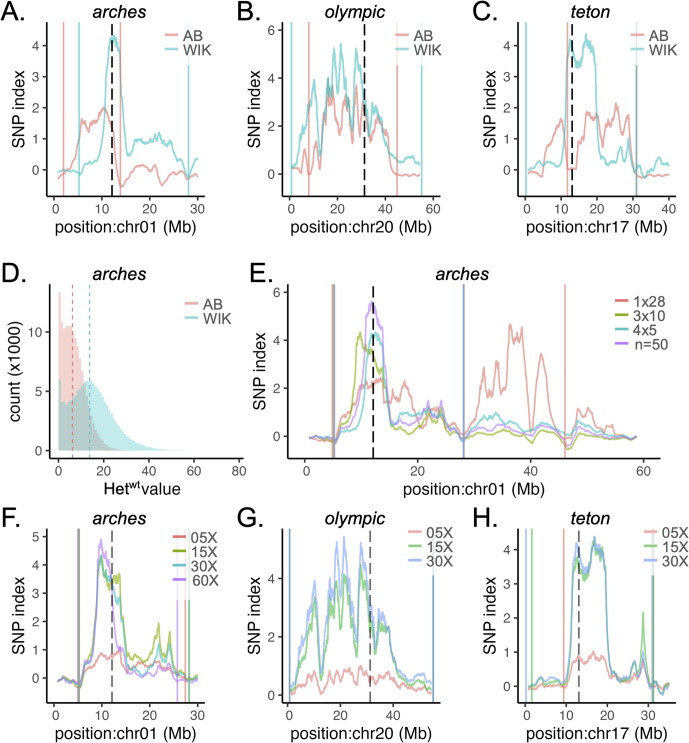
A-C) regional SNP index profile for datasets generated in an AB or WIK background for arches (A), olympic (B), and teton (C) mutants. D) Hetwt distribution for arches AB 4x5 and WIK 4x5 datasets. Binwidth is 1. Dashed lines mark the median (AB: 6.163692, WIK: 13.81362). E) Regional SNP index for arches datasets generated from different combinations of clutches: 1x28, 3x10, or 4x5 (clutch x animals per clutch). The n = 50 dataset was generated by combining 15X coverage datasets from the 3x10 and 4x5 datasets to generate a 30X dataset representing 50 animals from 4 clutches. F-H) Regional SNP index profile for the arches WIK, 3x10 (F), olympic WIK (G), and teton WIK (H) datasets with sequencing coverage simulated at 05X, 15X, or 30X. For arches WIK, 3x10, additional reads were collected from the original sample to generate an ~ 60X dataset. For SNP index plots, solid lines indicate left and right bounds of the interval selected by WheresWalker, dashed lines indicate the position of the causative locus.

Acknowledgments
This image is the copyrighted work of the attributed author or publisher, and ZFIN has permission only to display this image to its users. Additional permissions should be obtained from the applicable author or publisher of the image. Full text @ PLoS Genet.