|
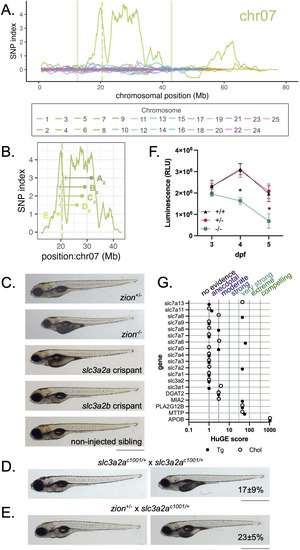
slc3a2azion is a novel regulator of B-lp metabolism. A) Elevated SNP index is observed on chromosome 7 in zion mutants; WheresWalker selected an interval from 19.03-26.02 Mb which was further analyzed. Solid vertical lines indicate interval bounds on chromosome 7. The vertical dashed line indicates the position of slc3a2a on chromosome 7. B) Mutant animals were genotyped for polymorphisms at 31609203 (Az), 29087847 (Bz), 28090051 (Cz), 26124850 (Dz), and 19034592 (Ez) bp to identify recombinants and predict the distance to the causative mutation. Points representing marker locations, and horizontal lines representing the estimated distance to mutation are overlaid on the SNP index for the interval. C) Representative images of larvae after editing at slc3a2a (dark yolk 41 ± 16%, N = 5, n = 248) and slc3a2b loci; non-injected larvae, as well as zion+/? and zion-/- siblings are shown for comparison. D) slc3a2ac1001/+ in-cross generates larvae with the dark yolk phenotype; dark yolk frequency is shown as mean ± standard deviation, N = 3, n = 876. E) slc3a2ac1001/+ crossed to zion+/- generates larvae with the dark yolk phenotype; dark yolk frequency is shown as mean ± standard deviation, N = 3, n = 299. For panels D-F, animals are 5 dpf, scale bar represents 1 mm. F) ApoBb.1-nanoluciferase quantification in zion mutants and siblings. Mean ± standard deviation, N = 3, n = 2–14, outliers were removed by the ROUT method (Q = 1%). P < 0.05 by two-way ANOVA with Geisser-Greenhouse correction and Tukey’s multiple comparisons test. * vs. + /- and +/ + . G) HuGE scores for SLC3 and SLC7 genes quantify the association of human variants with serum triglyceride (Tg) and total cholesterol (Chol). Genes with established links to B-lp synthesis are shown for comparison. HuGE association categories are noted on the top.
|