FIGURE SUMMARY
Title

Modeling high-risk pediatric cancers in zebrafish to inform precision therapy

Authors
Azzam, N., Fletcher, J.I., Melong, N., Lau, L.M.S., Dolman, M.E.M., Mao, J., Tax, G., Cadiz, R., Tuzi, L., Kamili, A., Dumevska, B., Xie, J., Chan, J.A., Senger, D.L., Grover, S.A., Malkin, D., Haber, M., Berman, J.N.
Source
Full text @ Cancer Res Commun

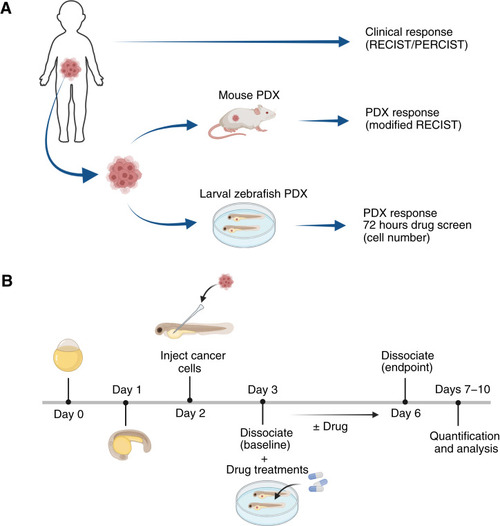
Overview of study design. A, Clinical responses in individual pediatric patients with cancer (RECIST/PERCIST criteria) were compared with drug responses in each patient’s cognate preclinical models–mouse PDX (RECIST criteria) and larval zebrafish PDX (viable cell number count). Primary tissue was obtained via biopsy or surgery as part of routine clinical care and frozen for storage or used directly for implantation. Tumor tissues were subcutaneously embedded in the mouse for expansion and drug testing. Cryopreserved tumor tissue or single cells from patient or mouse PDX were shipped from Australia to Canada for larval zebrafish xenograft generation. Injected larval zebrafish were treated with drug by immersion therapy. B, Larval zebrafish were injected with dissociated single tumor cells at 2 days post-fertilization (dpf), and immersion therapy was performed on 3 dpf injected fish for a 3-day treatment. Dissociation and quantification of tumor cells were performed at 3 dpf (baseline) and 6 dpf (after treatment). [Created in BioRender. Berman, J. (2025) https://BioRender.com/nbc71w1.]

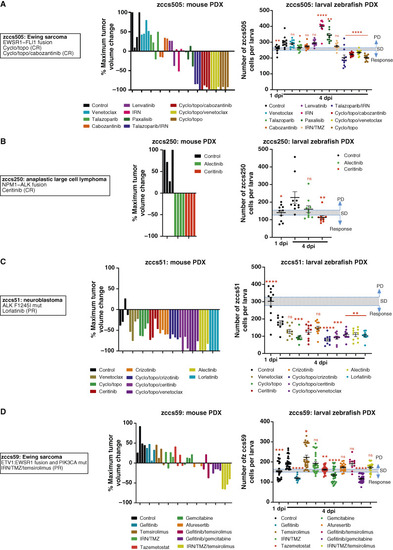
Mouse and larval zebrafish PDX drug efficacy for responsive patients. A to D, Patient information, alongside mouse PDX waterfall plot of maximum tumor regression, and larval zebrafish tumor cell numbers for each therapy for Ewing sarcoma zccs505 (A), anaplastic large cell lymphoma zccs250 (B), neuroblastoma zccs51 (C), and Ewing sarcoma zccs59 (D). For mouse PDX data, colored columns represent individual mice. For larval zebrafish data, error bars represent mean ± SEM, each colored dot represents an individual larva, and a threshold is based on SEM of 1 dpi. Statistical analysis was conducted using a one-way ANOVA with the Dunnett multiple comparisons test, comparing the mean of each treatment group with control (4 dpi), P values: *, < 0.05; **, < 0.01; ***, < 0.001; ****, < 0.0001. Treatments are ordered and colored the same in mouse and zebrafish studies. mut, mutant; dpi, days post-injection.

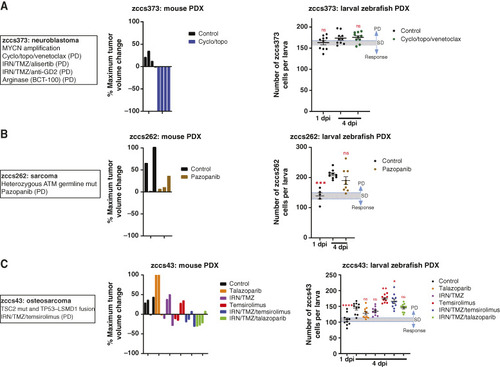
Mouse and larval zebrafish PDX drug efficacy for nonresponsive patients. A to C, Patient information, alongside mouse PDX waterfall plot of maximum tumor regression, and larval zebrafish tumor cell numbers for each therapy for neuroblastoma zccs373 (A), sarcoma zccs262 (B), and osteosarcoma zccs43 (C). For mouse PDX data, colored columns represent individual mice. For larval zebrafish data, error bars represent mean ± SEM, each colored dot represents an individual larva, and a threshold is based on SEM of 1 dpi. Statistical analysis was conducted using a one-way ANOVA with the Dunnett multiple comparisons test, comparing the mean of each treatment group with control (4 dpi), P values: *, < 0.05; **, < 0.01; ***, < 0.001; ****, < 0.0001). mut, mutant; dpi, days post-injection.

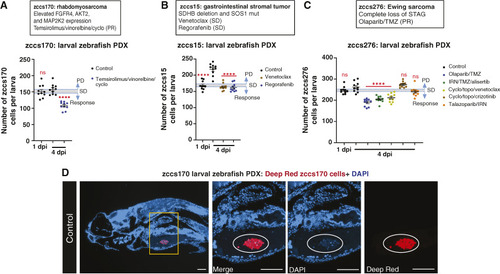
Larval zebrafish drug efficacy studies for patients with no available mouse PDX. A to C, Patient information, alongside larval zebrafish tumor cell numbers for each therapy for rhabdomyosarcoma zccs170 (A), gastrointestinal stromal tumor zccs15 (B), and Ewing sarcoma zccs276 (C). For larval zebrafish data, error bars represent mean ± SEM, each colored dot represents an individual larva, and a threshold is based on SEM of 1 dpi. Statistical analysis was conducted using a one-way ANOVA with the Dunnett multiple comparisons test, comparing the mean of each treatment group with control (4 dpi), P values: *, < 0.05; **, < 0.01; ***, < 0.001; ****, < 0.0001. D, Representative image of a five microns sectioned control larval zebrafish xenograft for patient zccs170. Deep Red–labeled patient cells present in the YS 4 dpi and labeled with DAPI to confirm viability. White circle in the images point to zccs170 tumor cells. Images were taken with 10× and 20× magnification. The scale bar is 100 µm. dpi, days post-injection.

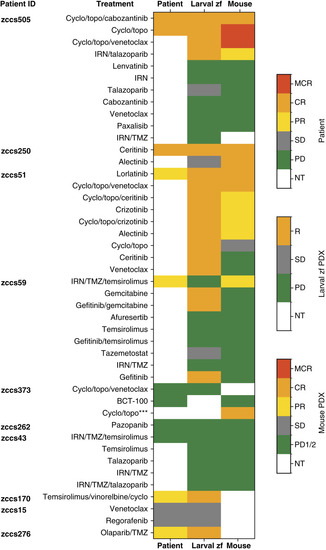
Consistency in drug response between patients and their cognate larval zebrafish and mouse PDX models. Evaluable response to therapy was compared for each patient and their cognate larval zebrafish PDX and mouse PDX models. Patient and mouse responses are indicated as OR criteria. Larval zebrafish PDX models are indicated as response (inhibition of cell growth), SD (cell number maintained), or PD (cell growth in the presence of drug). Maintained CR, CR, and PR for patient and mouse are considered equivalent to R (response) in the larval zebrafish model. The concordance of response for each model type with patient response is summarized in the legends on the right. ***For zccs373 (nonresponder to triple combination), mouse PDX responded to dual combination. MCR, maintained complete response; NT, not treated; zf, zebrafish.

Acknowledgments
This image is the copyrighted work of the attributed author or publisher, and ZFIN has permission only to display this image to its users. Additional permissions should be obtained from the applicable author or publisher of the image. Full text @ Cancer Res Commun