IMAGE

Figure 2

ID
ZDB-IMAGE-250729-78
Source
Figures for Azzam et al., 2025
Image
Figure Caption

Figure 2

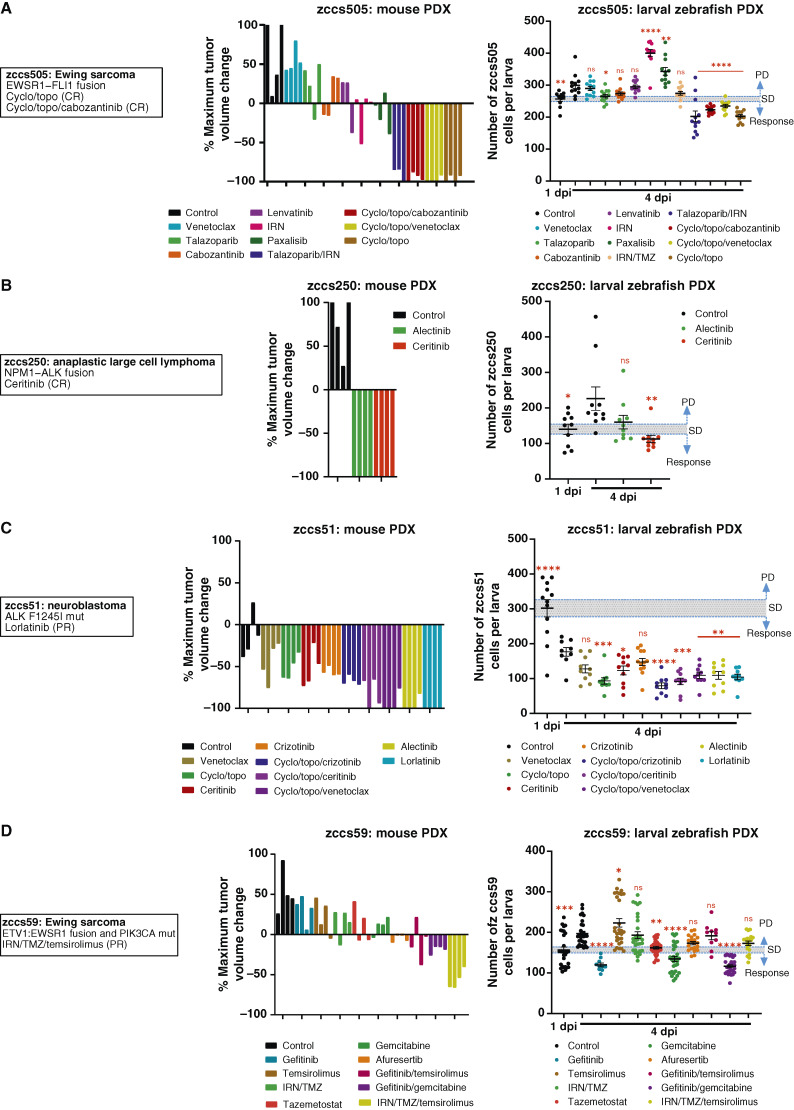
Mouse and larval zebrafish PDX drug efficacy for responsive patients. A to D, Patient information, alongside mouse PDX waterfall plot of maximum tumor regression, and larval zebrafish tumor cell numbers for each therapy for Ewing sarcoma zccs505 (A), anaplastic large cell lymphoma zccs250 (B), neuroblastoma zccs51 (C), and Ewing sarcoma zccs59 (D). For mouse PDX data, colored columns represent individual mice. For larval zebrafish data, error bars represent mean ± SEM, each colored dot represents an individual larva, and a threshold is based on SEM of 1 dpi. Statistical analysis was conducted using a one-way ANOVA with the Dunnett multiple comparisons test, comparing the mean of each treatment group with control (4 dpi), P values: *, < 0.05; **, < 0.01; ***, < 0.001; ****, < 0.0001. Treatments are ordered and colored the same in mouse and zebrafish studies. mut, mutant; dpi, days post-injection.

Acknowledgments
This image is the copyrighted work of the attributed author or publisher, and ZFIN has permission only to display this image to its users. Additional permissions should be obtained from the applicable author or publisher of the image. Full text @ Cancer Res Commun