FIGURE

Figure 3

ID
ZDB-FIG-250729-79
Publication
Azzam et al., 2025 - Modeling high-risk pediatric cancers in zebrafish to inform precision therapy
Other Figures
All Figure Page
Back to All Figure Page
Figure 3

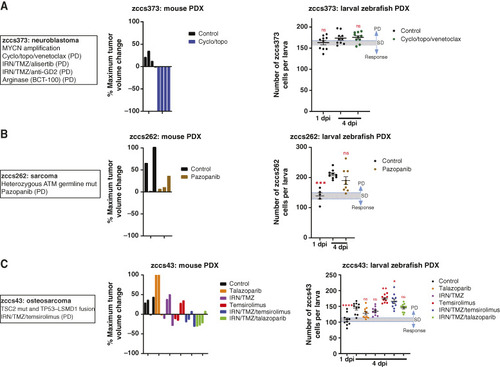
Mouse and larval zebrafish PDX drug efficacy for nonresponsive patients. A to C, Patient information, alongside mouse PDX waterfall plot of maximum tumor regression, and larval zebrafish tumor cell numbers for each therapy for neuroblastoma zccs373 (A), sarcoma zccs262 (B), and osteosarcoma zccs43 (C). For mouse PDX data, colored columns represent individual mice. For larval zebrafish data, error bars represent mean ± SEM, each colored dot represents an individual larva, and a threshold is based on SEM of 1 dpi. Statistical analysis was conducted using a one-way ANOVA with the Dunnett multiple comparisons test, comparing the mean of each treatment group with control (4 dpi), P values: *, < 0.05; **, < 0.01; ***, < 0.001; ****, < 0.0001). mut, mutant; dpi, days post-injection.

Expression Data

Expression Detail
Antibody Labeling
Phenotype Data

Phenotype Detail
Acknowledgments
This image is the copyrighted work of the attributed author or publisher, and ZFIN has permission only to display this image to its users. Additional permissions should be obtained from the applicable author or publisher of the image. Full text @ Cancer Res Commun