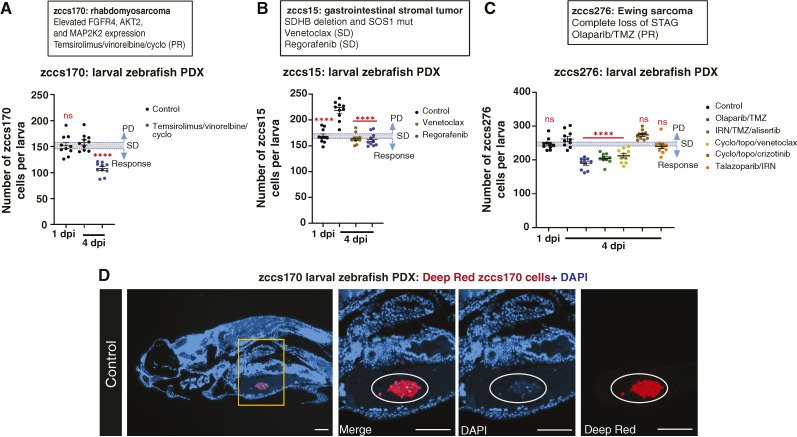
Larval zebrafish drug efficacy studies for patients with no available mouse PDX. A to C, Patient information, alongside larval zebrafish tumor cell numbers for each therapy for rhabdomyosarcoma zccs170 (A), gastrointestinal stromal tumor zccs15 (B), and Ewing sarcoma zccs276 (C). For larval zebrafish data, error bars represent mean ± SEM, each colored dot represents an individual larva, and a threshold is based on SEM of 1 dpi. Statistical analysis was conducted using a one-way ANOVA with the Dunnett multiple comparisons test, comparing the mean of each treatment group with control (4 dpi), P values: *, < 0.05; **, < 0.01; ***, < 0.001; ****, < 0.0001. D, Representative image of a five microns sectioned control larval zebrafish xenograft for patient zccs170. Deep Red–labeled patient cells present in the YS 4 dpi and labeled with DAPI to confirm viability. White circle in the images point to zccs170 tumor cells. Images were taken with 10× and 20× magnification. The scale bar is 100 µm. dpi, days post-injection.
Acknowledgments
This image is the copyrighted work of the attributed author or publisher, and
ZFIN has permission only to display this image to its users.
Additional permissions should be obtained from the applicable author or publisher of the image.
Full text @ Cancer Res Commun
Your Input Welcome
Thank you for submitting comments. Your input has been emailed to ZFIN curators who may contact you if
additional information is required.
Oops. Something went wrong. Please try again later.