
- Title
-
Tafazzin-deficient zebrafish display mitochondrial dysfunction, neutropenia, and metabolic defects without myopathy
- Authors
- Oyarbide, U., Anderson, R.A., Radzikh, I., Kodger, J.V., Patil, A.S., Staton, M., Mulya, A., Crane, G.M., Litovsky, S., Sandlers, Y., Corey, S.J.
- Source
- Full text @ Sci. Rep.
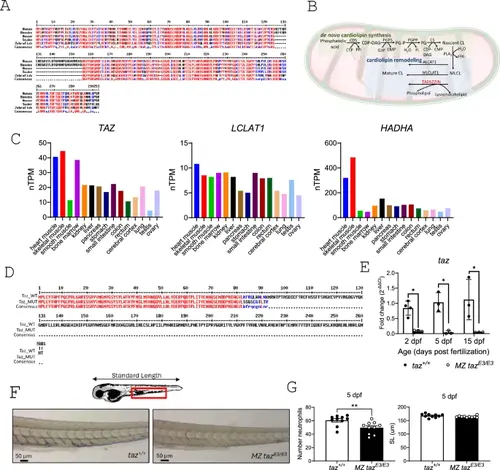
CRISPR/Cas9 genome editing of zebrafish tafazzin. (A) Amino acid sequence alignment of TAFAZZIN in selected vertebrates. Conserved sequences indicated in red, similar in blue, and variable in black. Found only in primates, the TAFAZZIN gene contains an additional exon which encodes a unique 30 amino acid sequence. (B) Cardiolipin synthesis and remodeling pathways. (C) mRNA expression of enzymes (HADHA; Hydroxyacyl-CoA Dehydrogenase Trifunctional Multienzyme Complex Subunit Alpha; LCLAT1, Lysocardiolipin Acyltransferase 1; TAZ, TAFAZZIN) involved in cardiolipin remodeling in different human tissues (https://www.proteinatlas.org). (D) Protein sequence alignment of wild-type Tafazzin and mutant (tazE3) (E) RT-qPCR of tafazzin showing decreased transcript, perhaps secondary to nonsense-mediated decay, comparing to wildtype. (F) Sudan black staining of larvae for neutrophils at 5 dpf (G) Neutrophil quantitation and standard length at 5 dpf. *p<0.05; **p<0.01; MZ, maternal zygotic. |
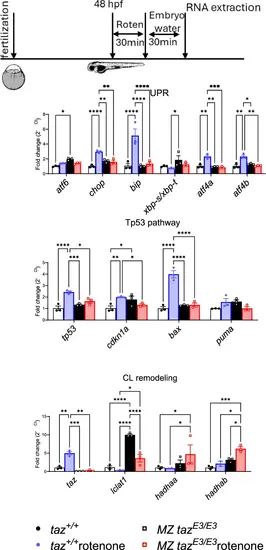
Mitochondrial stress marker analysis in tafazzin-deficient zebrafish: Effects of rotenone inhibition of Complex I. *p<0.05; **p<0.01; ***p<0.001; **** p<0.0001. |
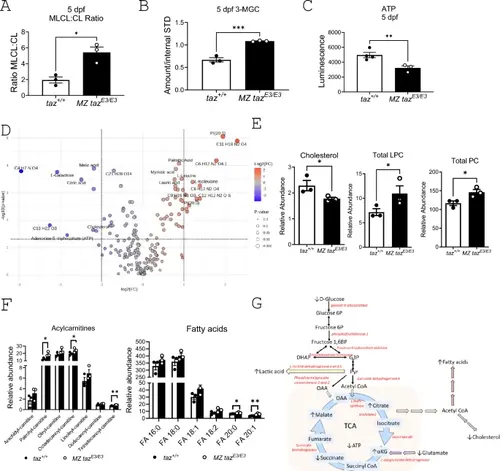
Metabolomic comparison of wild-type versus tafazzin-deficient 5 dpf larvae metabolomics. (A) Total MLCL: CL ratio and (B) 3-MGC (C) ATP production. (D) Untargeted metabolomics: volcano plot showing metabolites significantly upregulated (red) or downregulated (blue) in mutants compared to wildtype. The significant features highlighted in the volcano plot were defined as having a false discovery rate <0.05 and fold change >1.5. Blue color indicates MZ tazE3/E3 express lower levels on identified metabolites. Unique molecular formulas were determined by high-resolution, accurate intact mass, isotopic patterns, and MS/MS analyses. (E) Cholesterol, Total LPC and Total PC (F) Acylcarnitine and Fatty acids. (G) Metabolic pathways affected in tafazzin-deficient fish are illustrated, with altered metabolites marked by arrows and enzymes with upregulated mRNA expression highlighted in red font. *p<0.05; **p<0.01; ***p<0.001. |
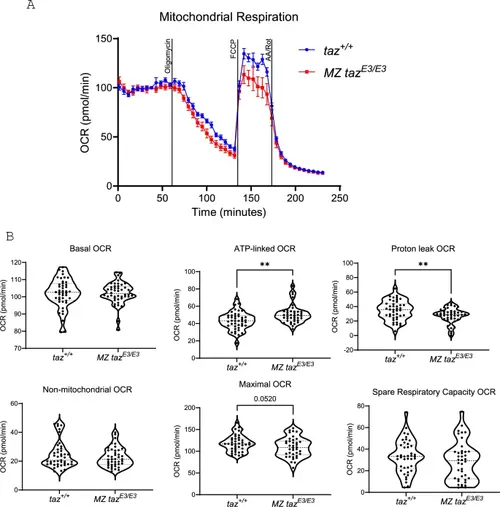
Mitochondrial dysfunction in tafazzin-deficient embryos. (A) Diagram showing oxygen consumption rates (OCR) for wildtype (blue line) and MZ tazE3/E3 (red line) zebrafish embryo following the addition of oligomycin, FCCP, and rotenone. Error bars represent the standard error of the mean (SEM). (B) Oxygen consumption rates for basal, non-mitochondrial respiration, maximal, proton leak, ATP-linked respiration and spare respiratory capacity. Each dot in the figure represents the value of one independent embryo. Results showing three independent experiments. Each experiment included 15 embryos per genotype. *p<0.05; **p<0.01. |
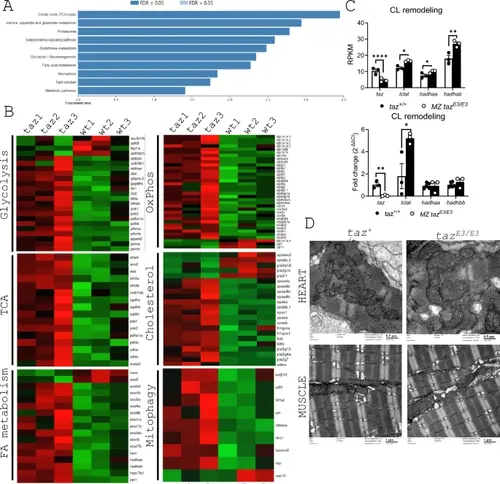
Changes in the transcriptomic profiling of tafazzin-deficient zebrafish larvae. (A) KEGG enrichment analysis of DEGs. (B) List of the DEGs. (C) Reads Per Kilobase per Million mapped fragments (RFKM) of genes related to CL maturation and q values and validation by RT-qPCR. (D) Electron micrographs show in the wildtype and tafazzin at 5 dpf—heart and muscle the presence of abundant mitochondria with double membrane system and cristae. There are no significant differences between the wildtype and tafazzin mutants—in the density and morphology of mitochondria. Likewise, the sarcomeres, well demarcated by the Z lines, show no significant differences between both groups in heart and muscle. Note the different scale between both tissue types micrographs.*p<0.05; **p<0.01. |
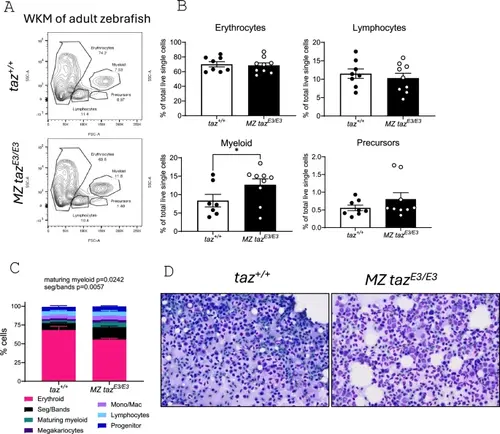
Adult tafazzin-deficient zebrafish exhibited increased MLCL: CL ratio in heart and whole kidney marrow but survive until adulthood. (A) Flow cytometric analysis and (B) quantification of blood cells. (C) Differential cell counts in kidney marrows and (D) kidney touch preparations of wildtype and tafazzin mutants at 60X magnification *p<0.05. |
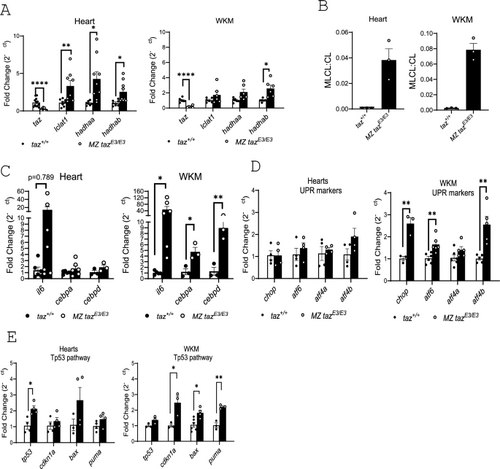
Inflammatory response in adult tafazzin-deficient fish. (A) mRNA levels of CL remodeling enzymes in heart and whole kidney marrow (WKM). (B) MLCL: CL ratio is reduced in heart and WKM. RT-qPCR results for (C) Inflammation (D) UPR, and (E) Tp53 pathway markers. *p<0.05; **p<0.01; ***p<0.001; **** p<0.0001. |