
Fig. 5
- ID
- ZDB-IMAGE-250728-64
- Publication
- Oyarbide et al., 2025 - Tafazzin-deficient zebrafish display mitochondrial dysfunction, neutropenia, and metabolic defects without myopathy
- All Figures
- Figures for Oyarbide et al., 2025
|
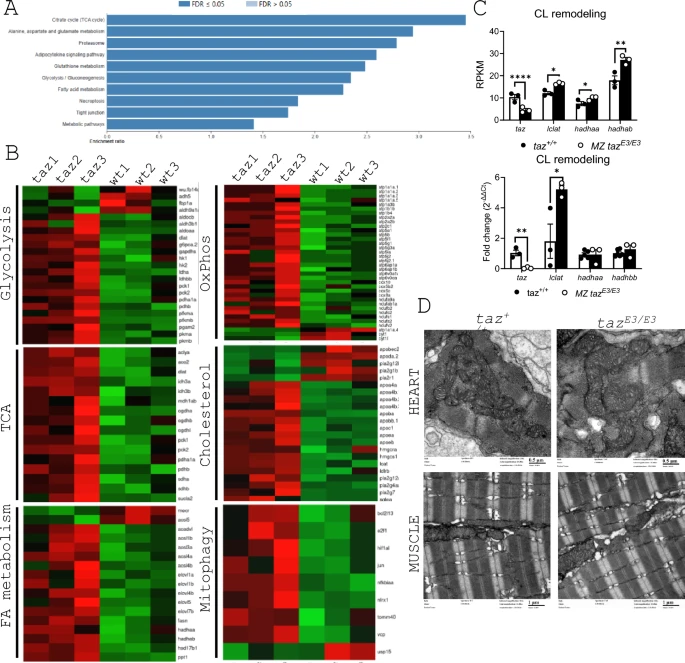
Fig. 5 Changes in the transcriptomic profiling of tafazzin-deficient zebrafish larvae. (A) KEGG enrichment analysis of DEGs. (B) List of the DEGs. (C) Reads Per Kilobase per Million mapped fragments (RFKM) of genes related to CL maturation and q values and validation by RT-qPCR. (D) Electron micrographs show in the wildtype and tafazzin at 5 dpf—heart and muscle the presence of abundant mitochondria with double membrane system and cristae. There are no significant differences between the wildtype and tafazzin mutants—in the density and morphology of mitochondria. Likewise, the sarcomeres, well demarcated by the Z lines, show no significant differences between both groups in heart and muscle. Note the different scale between both tissue types micrographs.*p<0.05; **p<0.01.