
Fig. 4
- ID
- ZDB-IMAGE-250728-63
- Publication
- Oyarbide et al., 2025 - Tafazzin-deficient zebrafish display mitochondrial dysfunction, neutropenia, and metabolic defects without myopathy
- All Figures
- Figures for Oyarbide et al., 2025
|
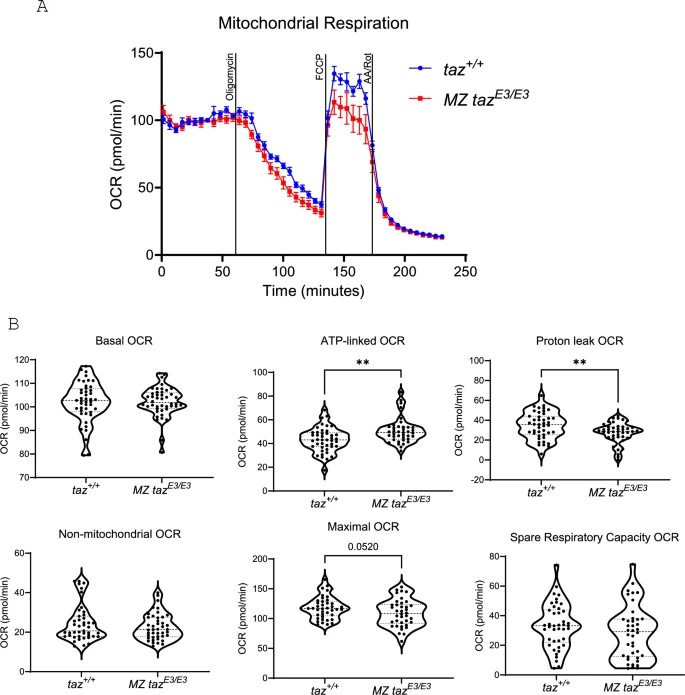
Fig. 4 Mitochondrial dysfunction in tafazzin-deficient embryos. (A) Diagram showing oxygen consumption rates (OCR) for wildtype (blue line) and MZ tazE3/E3 (red line) zebrafish embryo following the addition of oligomycin, FCCP, and rotenone. Error bars represent the standard error of the mean (SEM). (B) Oxygen consumption rates for basal, non-mitochondrial respiration, maximal, proton leak, ATP-linked respiration and spare respiratory capacity. Each dot in the figure represents the value of one independent embryo. Results showing three independent experiments. Each experiment included 15 embryos per genotype. *p<0.05; **p<0.01.