
Fig. 3
- ID
- ZDB-FIG-250728-62
- Publication
- Oyarbide et al., 2025 - Tafazzin-deficient zebrafish display mitochondrial dysfunction, neutropenia, and metabolic defects without myopathy
- Other Figures
- All Figure Page
- Back to All Figure Page
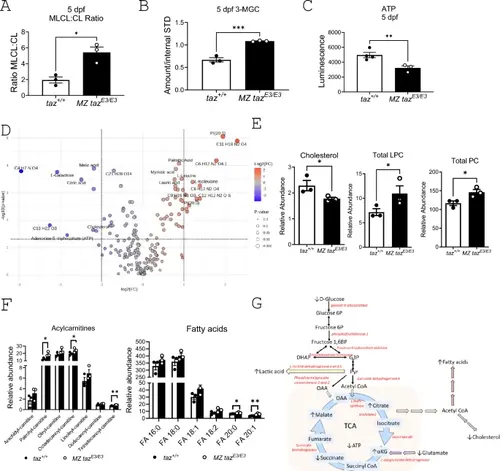
Metabolomic comparison of wild-type versus tafazzin-deficient 5 dpf larvae metabolomics. (A) Total MLCL: CL ratio and (B) 3-MGC (C) ATP production. (D) Untargeted metabolomics: volcano plot showing metabolites significantly upregulated (red) or downregulated (blue) in mutants compared to wildtype. The significant features highlighted in the volcano plot were defined as having a false discovery rate <0.05 and fold change >1.5. Blue color indicates MZ tazE3/E3 express lower levels on identified metabolites. Unique molecular formulas were determined by high-resolution, accurate intact mass, isotopic patterns, and MS/MS analyses. (E) Cholesterol, Total LPC and Total PC (F) Acylcarnitine and Fatty acids. (G) Metabolic pathways affected in tafazzin-deficient fish are illustrated, with altered metabolites marked by arrows and enzymes with upregulated mRNA expression highlighted in red font. *p<0.05; **p<0.01; ***p<0.001. |