
- Title
-
Peptide GTSFTTTAER From Rapana venosa Alleviates TNBS-Induced Inflammatory Bowel Disease in a Zebrafish Model via Multi-Pathway Regulation
- Authors
- Wang, Q., Xu, F., Cao, Y., Li, B., Zhang, S., Zhang, Y.
- Source
- Full text @ Food Sci Nutr
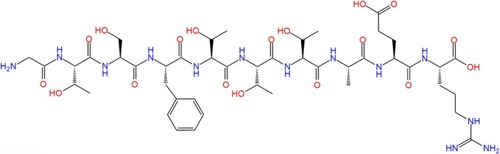
The 2D structure of peptide GTSFTTTAER. |
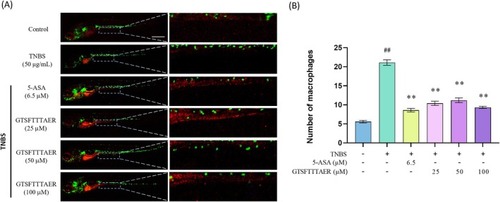
GTSFTTTAER inhibited the 2,4,6‐trinitrobenzene sulfonic acid (TNBS)‐induced increase of immune cells in the zebrafish larvae intestine. Scale bar is 500 μm. (A) Representative fluorescence images of Tg ( |
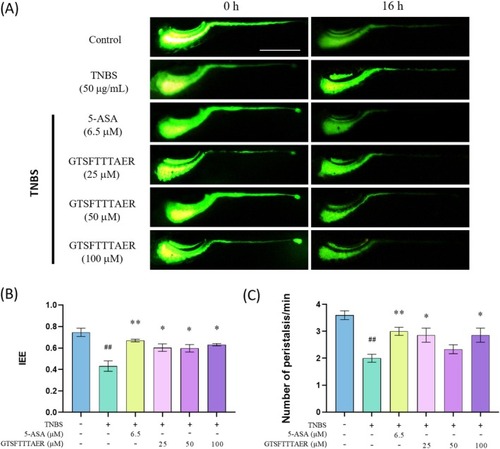
Improvement of GTSFTTTAER on TNBS‐induced intestinal motility impairment of zebrafish larvae. Scale bar is 500 μm. (A) Typical fluorescence images of wild‐type zebrafish intestine. (B) Statistical analysis of the intestinal efflux efficiency. (C) Statistical analysis of the frequency of intestinal peristalsis. ## |
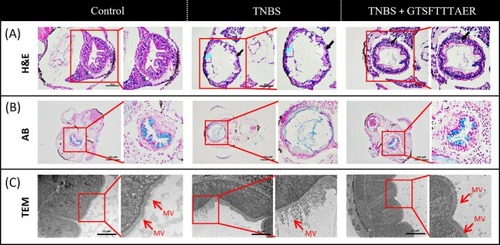
Effects of GTSFTTTAER on TNBS‐induced intestinal tissue of zebrafish larvae. (A) Hematoxylin and Eosin staining of intestinal tissues. Black arrow: The state of intestinal cells; blue arrow: Mucosal layer necrosis, cell lysis, disappearance of intestinal folds. Scale bar is 50 μm. (B) Alcian blue staining of intestinal tissues. Scale bar is 100 μm. (C) Transmission electron microscopy of the intestinal ultrastructure in zebrafish. Mv represents intestinal microvilli. Scale bar is 20 μm. |

Analysis of differentially expressed genes (DEGs). (A) Histogram of DEGs statistics for TNBS versus Control, GTSFTTTAER versus TNBS, and GTSFTTTAER versus Control. (B) Venn diagram of common and unique DEGs between the TNBS versus Control and GTSFTTTAER versus TNBS comparison groups. (C) Differential gene radar chart for TNBS versus Control. (D) Differential gene radar chart for GTSFTTTAER versus TNBS. First circle: Up‐regulated genes are light red and down‐regulated genes are light blue; the size of the circle varies according to the size of the log2(FC) value. Second circle: The data represent the average expression for each gene in groups. |
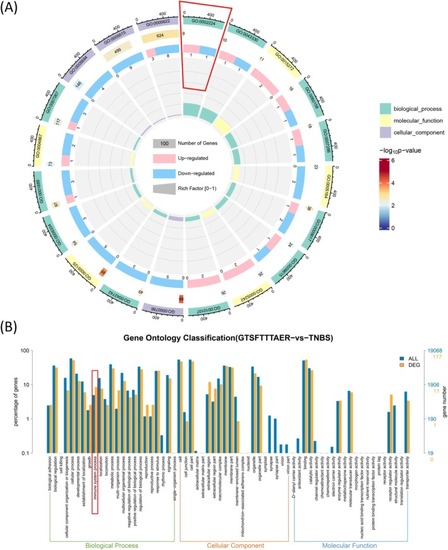
Gene Ontology (GO) enrichment analysis of DEGs in the GTSFTTTAER versus TNBS group. (A) Circle plot of DEGs and all genes in GO enrichment analysis. (B) Comparative plot of the distribution of DEGs and all genes at GO Level 2. |
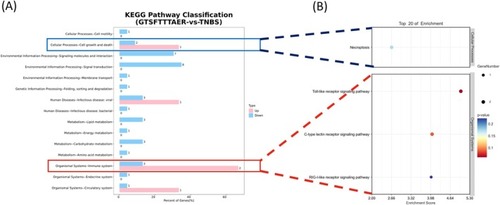
Kyoto Encyclopedia of Genes and Genomes (KEGG) analysis of DEGs in the GTSFTTTAER versus TNBS group. (A) KEGG Level2 distribution map of up‐regulated and down‐regulated DEGs. (B) Bubble diagram of DEGs in the KEGG enrichment analysis. |
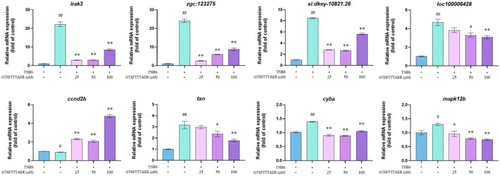
Reverse transcription‐quantitative polymerase chain reaction results of peptide GTSFTTTAER on the expression of representative genes screened by transcriptome. # |
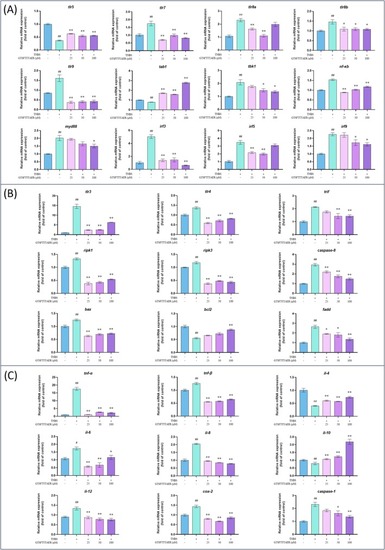
Effect of peptide GTSFTTTAER at the RNA level on inflammatory bowel disease in zebrafish. (A) Expression of genes related to Toll‐like receptor (TLR) signaling pathway. (B) Expression of genes related to the necroptosis signaling pathway. (C) Expression of inflammation‐related genes. # |
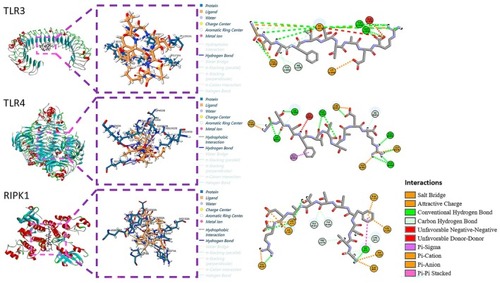
The molecular docking of peptide GTSFTTTAER to TLR3, TLR4, and RIPK1 protein. |