
Image
|
Figure Caption
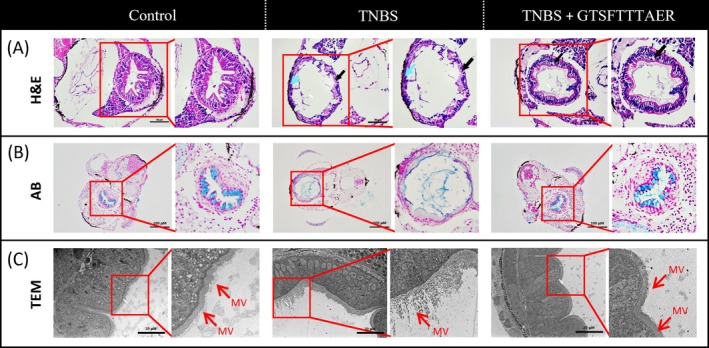
FIGURE 4
Effects of GTSFTTTAER on TNBS‐induced intestinal tissue of zebrafish larvae. (A) Hematoxylin and Eosin staining of intestinal tissues. Black arrow: The state of intestinal cells; blue arrow: Mucosal layer necrosis, cell lysis, disappearance of intestinal folds. Scale bar is 50 μm. (B) Alcian blue staining of intestinal tissues. Scale bar is 100 μm. (C) Transmission electron microscopy of the intestinal ultrastructure in zebrafish. Mv represents intestinal microvilli. Scale bar is 20 μm.
Acknowledgments
This image is the copyrighted work of the attributed author or publisher, and
ZFIN has permission only to display this image to its users.
Additional permissions should be obtained from the applicable author or publisher of the image.
Full text @ Food Sci Nutr