
Image
|
Figure Caption
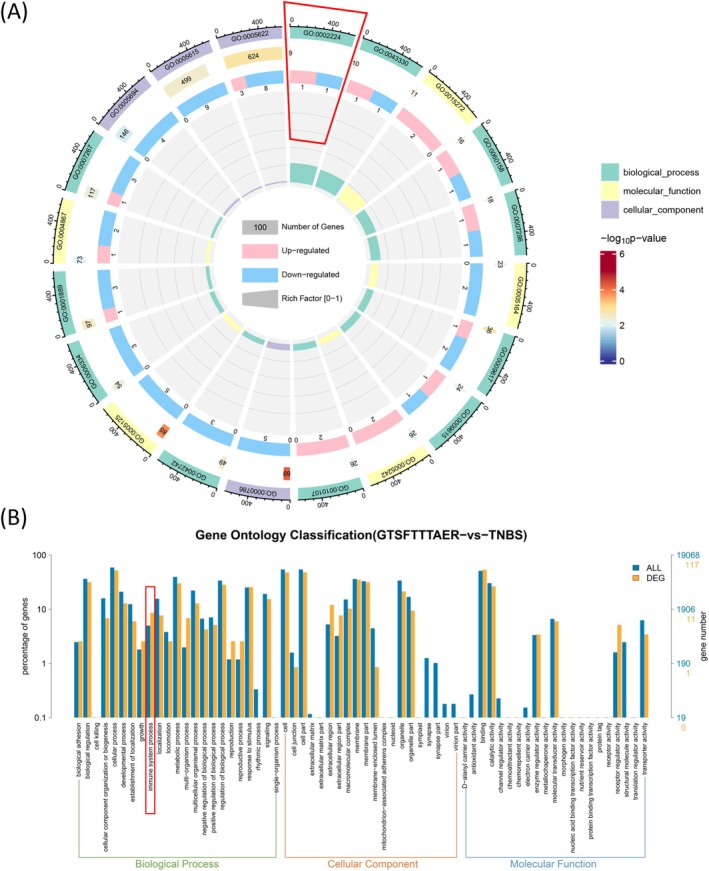
FIGURE 6
Gene Ontology (GO) enrichment analysis of DEGs in the GTSFTTTAER versus TNBS group. (A) Circle plot of DEGs and all genes in GO enrichment analysis. (B) Comparative plot of the distribution of DEGs and all genes at GO Level 2.
Acknowledgments
This image is the copyrighted work of the attributed author or publisher, and
ZFIN has permission only to display this image to its users.
Additional permissions should be obtained from the applicable author or publisher of the image.
Full text @ Food Sci Nutr