
Image
|
Figure Caption
FIGURE 8
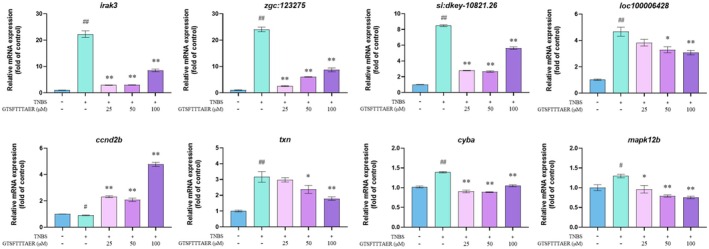
Reverse transcription‐quantitative polymerase chain reaction results of peptide GTSFTTTAER on the expression of representative genes screened by transcriptome. #
Acknowledgments
This image is the copyrighted work of the attributed author or publisher, and
ZFIN has permission only to display this image to its users.
Additional permissions should be obtained from the applicable author or publisher of the image.
Full text @ Food Sci Nutr