
Image
|
Figure Caption
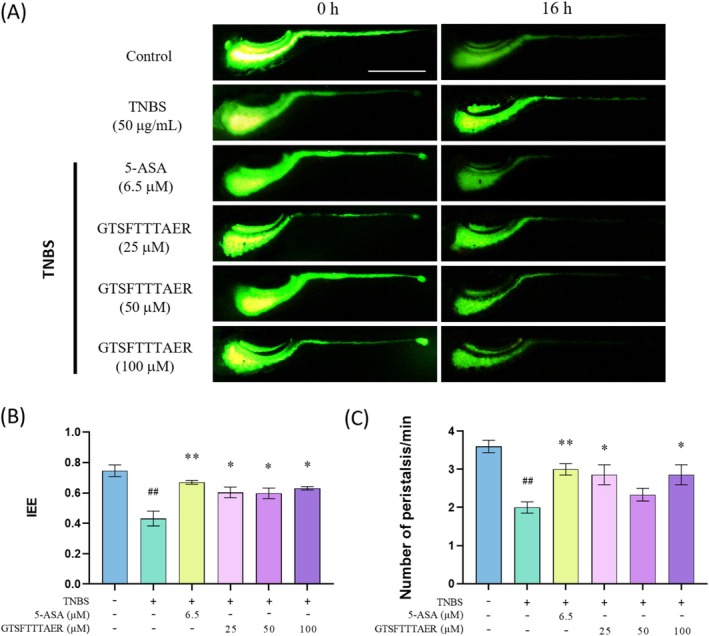
FIGURE 3
Improvement of GTSFTTTAER on TNBS‐induced intestinal motility impairment of zebrafish larvae. Scale bar is 500 μm. (A) Typical fluorescence images of wild‐type zebrafish intestine. (B) Statistical analysis of the intestinal efflux efficiency. (C) Statistical analysis of the frequency of intestinal peristalsis. ##
Acknowledgments
This image is the copyrighted work of the attributed author or publisher, and
ZFIN has permission only to display this image to its users.
Additional permissions should be obtained from the applicable author or publisher of the image.
Full text @ Food Sci Nutr