FIGURE SUMMARY
Title

Evolution of warming tolerance alters physiology and life history traits in zebrafish

Authors
Andreassen, A.H., Clements, J.C., Morgan, R., Spatafora, D., Metz, M., Åsheim, E.R., Pélabon, C., Jutfelt, F.
Source
Full text @ Nat Clim Chang

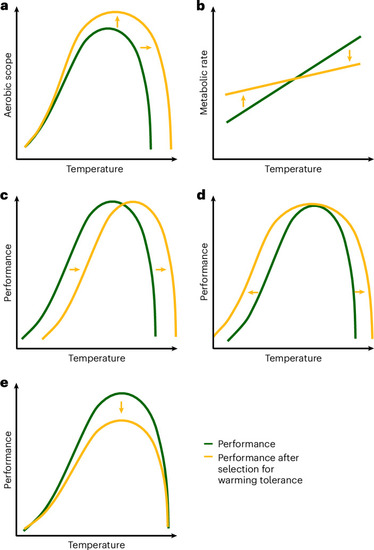
Different mechanisms may be responsible for the evolution of warming tolerance.

ae, These different mechanisms may be distinguished by their specific effects on various phenotypic traits (yellow lines). Changes in warming tolerance may result from increased oxygen supply capacity (a) or lower thermal sensitivity of metabolic traits (b). Changes in the thermal optimum of molecules may affect cell membrane fluidity and enzyme function leading to a shift in thermal optimum and warming tolerance (c). Selection for warming tolerance may lead to increased expression of heat shock proteins protecting against thermal extremes and may increase performance at both warming and cooling extremes (d). Trade-offs with warming tolerance may lower performance, such as growth or reproduction, when warming tolerance increases (e).

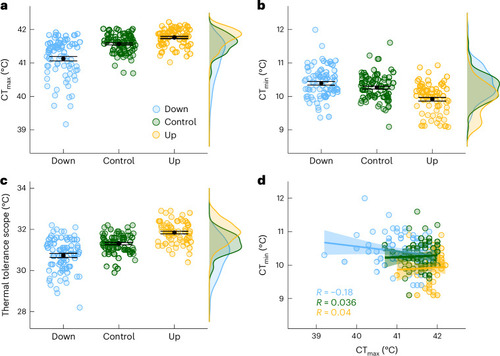
Thermal tolerance of fish artificially selected for warming tolerance.

a, Acute upper thermal tolerance limit (CTmax; n = individuals: Down = 78, Control = 78, Up = 70). b, Acute lower thermal tolerance limit (CTmin; n = individuals: Down = 78, Control = 77, Up = 70). c, Thermal tolerance scope (CTmax − CTmin; n = individuals: Down = 78, Control = 77, Up = 70). d, Correlation between CTmax and CTmin. Data from the two measurement periods are pooled. Data are presented with mean (black points) ± s.e. (error bars).

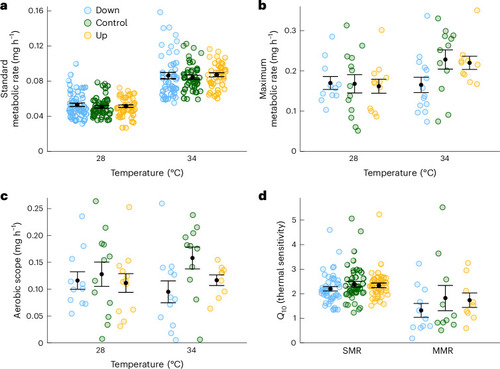
Effects of selection treatment and temperature on metabolic rates.

a, SMR of individuals (n = individuals at 28 °C: Down = 58, Control = 52, Up = 50; and at 34 °C: Down = 49, Control = 44, Up = 41). b, MMR estimated as average MMR per individual measured in groups of three to four fish (n = groups at 28 °C: Down = 11, Control = 13, Up = 12; and at 34 °C: Down = 14, Control = 12, Up = 10). Both SMR and MMR are adjusted to a mean mass of 105 mg. c, Aerobic metabolic scope (MMR − SMR; n = groups at 28 °C: Down = 11, Control = 13, Up = 12; and at 34 °C: Down = 13, Control = 12, Up = 9). d, Metabolic response to temperature (Q10) of SMR (n = individuals: Down = 49, Control = 44, Up = 41) and MMR (n = groups: Down = 11, Control = 10, Up = 9). Data from the two measurement periods are pooled. Data are presented with mean (black points) ± s.e. (error bars).

Effects of warming tolerance selection on life history and physiological traits.

a, Number of eggs from spawning boxes (n = boxes: Down = 17, Control = 14, Up = 14) during the initial round of reproduction. b, Egg diameter of a subset of ten eggs from each box (n = eggs: Down = 223, Control = 263, Up = 287). c, Initial weight (n = individuals at 44–47 dpf: Down = 78, Control = 78, Up = 70). d, Final weight (n= individuals at 74–100 dpf: Down = 78, Control = 78, Up = 70). e, Specific growth rate (n = individuals: Down = 77, Control = 78, Up = 70). f, Maximum swim speed (n = individuals at 28 °C: Down = 27, Control = 28, Up = 25; and at 34 °C: Down = 22, Control = 27, Up = 25). g, Thermal preference (n = individuals: Down = 22, Control = 26, Up = 23). Data from the two measurement periods are pooled (dg). h, Brain HSP70 level relative to the Control treatment at baseline (n = individuals at baseline: Down = 12, Control = 11, Up = 12; and after heat shock: Down = 10, Control = 13, Up = 12). Data are presented with mean (black points) ± s.e. (error bars).

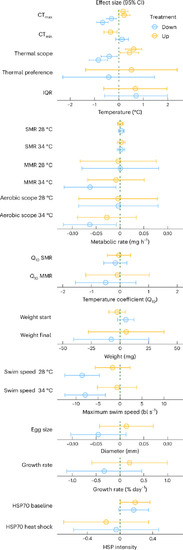
Effect of selection for acute upper thermal tolerance in Up-selected (yellow) or Down-selected (blue) fish.

Effect sizes are presented as difference from the Control treatment (dashed line in the centre) with their 95% CI (error bars) obtained from models including selection treatment as fixed factor. IQR, interquartile range of occupied temperature in a thermal gradient.

Acknowledgments
This image is the copyrighted work of the attributed author or publisher, and ZFIN has permission only to display this image to its users. Additional permissions should be obtained from the applicable author or publisher of the image. Full text @ Nat Clim Chang