IMAGE

Fig. 4

ID
ZDB-IMAGE-250617-5
Source
Figures for Andreassen et al., 2025
Image
Figure Caption

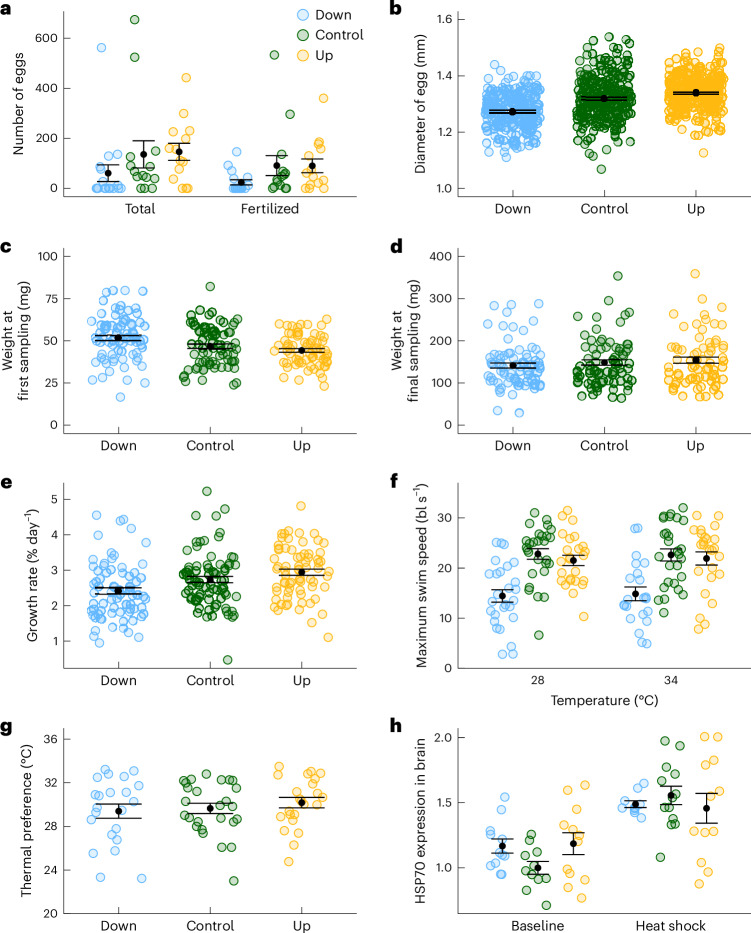
Fig. 4 Effects of warming tolerance selection on life history and physiological traits.

a, Number of eggs from spawning boxes (n = boxes: Down = 17, Control = 14, Up = 14) during the initial round of reproduction. b, Egg diameter of a subset of ten eggs from each box (n = eggs: Down = 223, Control = 263, Up = 287). c, Initial weight (n = individuals at 44–47 dpf: Down = 78, Control = 78, Up = 70). d, Final weight (n= individuals at 74–100 dpf: Down = 78, Control = 78, Up = 70). e, Specific growth rate (n = individuals: Down = 77, Control = 78, Up = 70). f, Maximum swim speed (n = individuals at 28 °C: Down = 27, Control = 28, Up = 25; and at 34 °C: Down = 22, Control = 27, Up = 25). g, Thermal preference (n = individuals: Down = 22, Control = 26, Up = 23). Data from the two measurement periods are pooled (dg). h, Brain HSP70 level relative to the Control treatment at baseline (n = individuals at baseline: Down = 12, Control = 11, Up = 12; and after heat shock: Down = 10, Control = 13, Up = 12). Data are presented with mean (black points) ± s.e. (error bars).

Acknowledgments
This image is the copyrighted work of the attributed author or publisher, and ZFIN has permission only to display this image to its users. Additional permissions should be obtained from the applicable author or publisher of the image. Full text @ Nat Clim Chang