IMAGE

Fig. 1

ID
ZDB-IMAGE-250617-2
Source
Figures for Andreassen et al., 2025
Image
Figure Caption

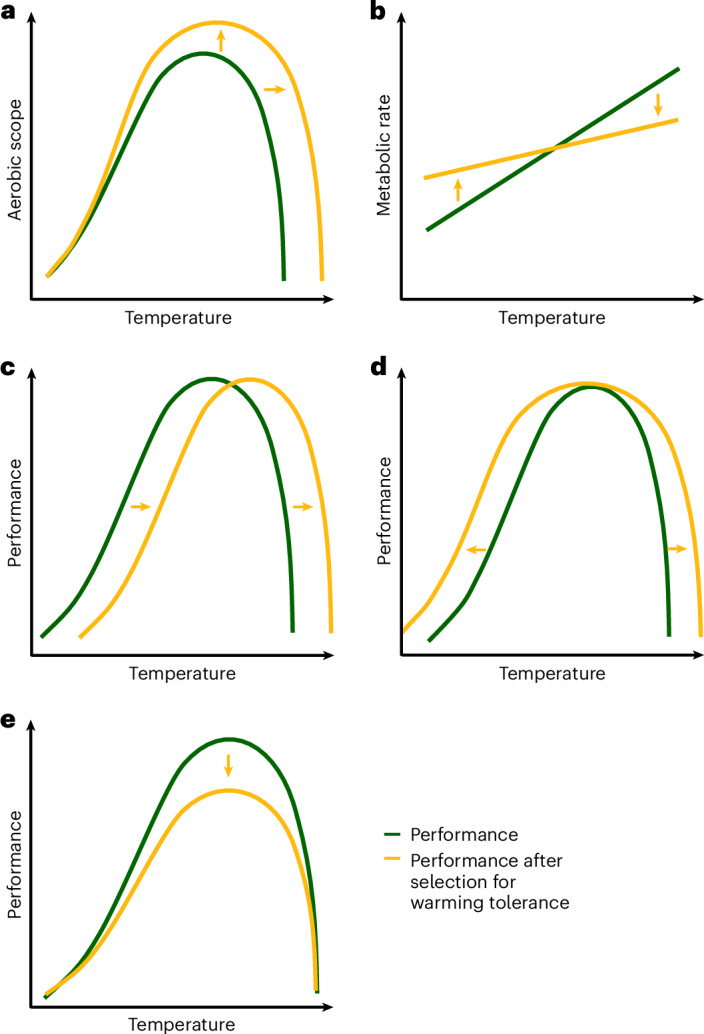
Fig. 1 Different mechanisms may be responsible for the evolution of warming tolerance.

ae, These different mechanisms may be distinguished by their specific effects on various phenotypic traits (yellow lines). Changes in warming tolerance may result from increased oxygen supply capacity (a) or lower thermal sensitivity of metabolic traits (b). Changes in the thermal optimum of molecules may affect cell membrane fluidity and enzyme function leading to a shift in thermal optimum and warming tolerance (c). Selection for warming tolerance may lead to increased expression of heat shock proteins protecting against thermal extremes and may increase performance at both warming and cooling extremes (d). Trade-offs with warming tolerance may lower performance, such as growth or reproduction, when warming tolerance increases (e).

Acknowledgments
This image is the copyrighted work of the attributed author or publisher, and ZFIN has permission only to display this image to its users. Additional permissions should be obtained from the applicable author or publisher of the image. Full text @ Nat Clim Chang