
FIGURE
Fig. 5
- ID
- ZDB-FIG-250617-11
- Publication
- Andreassen et al., 2025 - Evolution of warming tolerance alters physiology and life history traits in zebrafish
- Other Figures
- All Figure Page
- Back to All Figure Page
Fig. 5
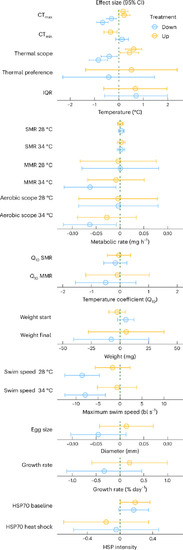
Effect of selection for acute upper thermal tolerance in Up-selected (yellow) or Down-selected (blue) fish. Effect sizes are presented as difference from the Control treatment (dashed line in the centre) with their 95% CI (error bars) obtained from models including selection treatment as fixed factor. IQR, interquartile range of occupied temperature in a thermal gradient. |
Expression Data
Expression Detail
Antibody Labeling
Phenotype Data
Phenotype Detail
Acknowledgments
This image is the copyrighted work of the attributed author or publisher, and
ZFIN has permission only to display this image to its users.
Additional permissions should be obtained from the applicable author or publisher of the image.
Full text @ Nat Clim Chang