IMAGE

Fig. 3

ID
ZDB-IMAGE-250617-4
Source
Figures for Andreassen et al., 2025
Image
Figure Caption

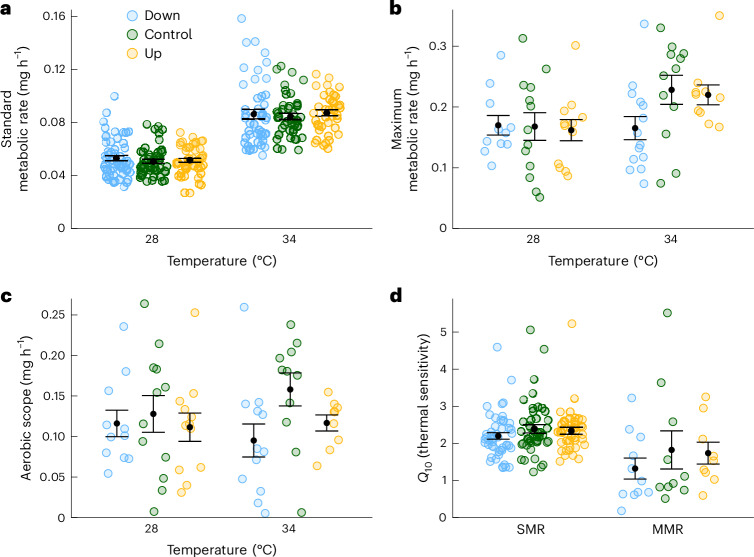
Fig. 3 Effects of selection treatment and temperature on metabolic rates.

a, SMR of individuals (n = individuals at 28 °C: Down = 58, Control = 52, Up = 50; and at 34 °C: Down = 49, Control = 44, Up = 41). b, MMR estimated as average MMR per individual measured in groups of three to four fish (n = groups at 28 °C: Down = 11, Control = 13, Up = 12; and at 34 °C: Down = 14, Control = 12, Up = 10). Both SMR and MMR are adjusted to a mean mass of 105 mg. c, Aerobic metabolic scope (MMR − SMR; n = groups at 28 °C: Down = 11, Control = 13, Up = 12; and at 34 °C: Down = 13, Control = 12, Up = 9). d, Metabolic response to temperature (Q10) of SMR (n = individuals: Down = 49, Control = 44, Up = 41) and MMR (n = groups: Down = 11, Control = 10, Up = 9). Data from the two measurement periods are pooled. Data are presented with mean (black points) ± s.e. (error bars).

Acknowledgments
This image is the copyrighted work of the attributed author or publisher, and ZFIN has permission only to display this image to its users. Additional permissions should be obtained from the applicable author or publisher of the image. Full text @ Nat Clim Chang