FIGURE SUMMARY
Title

miRNAs from Zebrafish Embryo Extracts Inhibit Breast Cancer Invasiveness and Migration by Modulating miR-218-5p/PI3K Pathway

Authors
Monti, N., Antinori, D., Proietti, S., Piombarolo, A., Querqui, A., Lentini, G., Liguoro, D., Aventaggiato, M., Lucarelli, M., Pensotti, A., Giuliani, A., Tafani, M., Fuso, A., Bizzarri, M.
Source
Full text @ Int. J. Mol. Sci.

miRNA sequence analysis performed on zebrafish embryos. Data are expressed as raw counts above noise floor.

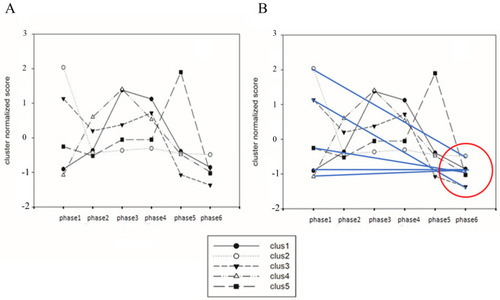
Dynamics of miRNAs are reported (A) highlighting how the main clusters (representing 94% of variance as assessed by PCA) converge into a stable attractor (B) located at phases 5–6, in which the difference in miRNAs expression is reduced to a minimum value.

Effects of 0.3 µg/mL and 3 µg/mL on the cell cycle of MDA-MB-231. Histograms illustrate the percentage of cells in each phase of the cell cycle. Treatment with ZFEs for 48 h does not affect the cell cycle (A). However, after 96 h of treatment, there is a significant decrease in the percentage of MDA-MB-231 cells in the S-phase and a corresponding increase in the G1-phase (B). Data are presented as mean ± SD. Statistical significance was determined using one-way ANOVA followed by Turkey’s multiple comparison test (* p < 0.05); ns: no significance.

Effects of 0.3 μg/mL of ZFEs and F6 on migration (A) and invasion (B) in MDA-MB-231 cells were assessed using Transwell assays. MDA-MB-231 cells were either untreated (ctrl) or treated with F6 or ZFEs for 24 h. Values represent the number of migrating and invading MDA-MB-231 cells. Histograms show the mean ± SD from three independent experiments performed in duplicate. Statistical significance was determined by one-way ANOVA followed by Tukey’s multiple comparison test (** p < 0.01; *** p < 0.001). Images were captured using optical microscopy. Scale bars represent 250 μm; ns: no significance.

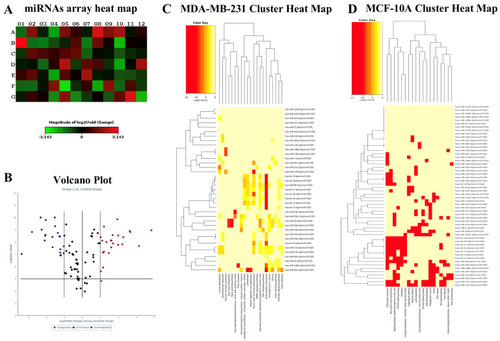
Array analysis of miRNAs. Heat map (A) and volcano plot (B) show that ZFEs treatment modulates miRNAs expression. Cluster analysis (C,D) evidenced the differences between the two cell lines.

miR-218-5p expression. The transcription of miR-218-5p was analyzed in MDA-MB-231 (A) and MCF-10A (B) cells following treatment with ZFEs. Real-time PCR analysis was performed on miR-218-5p in both cell lines, with MDA-MB-231 (A) and MCF-10A (B) pre-treated with TGF-β1, at 48 (black) and 96 (light gray) hours of culture. A significant increase in miR-218-5p expression was observed after 96 h of ZFEs treatment in both cell lines. Data are presented as mean ± SD. ** p < 0.01; *** p < 0.001.

PIK3C2A expression. The transcription of PIK3C2A was analyzed in MDA-MB-231 (A) and in TGF-β1-pre-treated MCF-10A cells (B) at 48 (black) and 96 (gray) hours of treatment with ZFE 0.3 μg/mL. A significant decreased expression of PIK3C2A in MDA-MB-231 was observed after 96 h of ZFEs treatment compared to 48 h. A lower expression of PIK3C2A in MCF-10A cells was observed upon ZFEs treatment, although this was without statistical significance. Data are represented as the mean value ± SD. ** p < 0.01; ns: no significance.

miR-218-5p transfection. Real-time PCR analysis of miR-218-5p (A) and its target PIK3C2A (B) in MDA-MB-231 transfected with a Mimic or an antisense (siRNA) miR-218-5p oligos. A direct correlation was demonstrated between the miR218-5p levels and the expression of PIK3C2A mRNA. Data are represented as mean value ± SD. * p < 0.05, ** p < 0.01, *** p < 0.001.

(A,B) Representative confocal images depicting PIP3 (red) and PI3K (green) in MDA-MB-231 cells cultured under control conditions and after 96 h of ZFEs treatment. In control cells, PI3K was localized in the cytosol, positioned just behind the cell membrane, and exhibited co-localization with PIP3, suggesting the strong enzymatic activity of PI3K (A). In contrast, ZFEs treatment resulted in the perinuclear localization of PI3K, with the PIP3 signal nearly disappearing (B). Scale bars: 20 μm (C,D) Representative confocal images of PIP2 (red) and Cofilin (green) in MDA-MB-231 cells under control conditions and following 96 h of ZFEs treatment. Control cells displayed a dense distribution of Cofilin beneath the cortical ring, aligning with the F-actin pattern (C). After ZFEs treatment, Cofilin became dispersed throughout the cytosol of MDA-MB-231 cells. Additionally, an increased accumulation of PIP2 at the cell membrane, co-localizing with Cofilin, occurred (D). Scale bars: 10 μm. (EH) Fluorescence intensity analysis from nucleus and cytoplasm of PI3K, PIP2, PIP3, and Cofilin in MDA-MB-231 cells. Fluorescence intensity was evaluated with ImageJ Software. A significant reduction in PI3K cytoplasm signal intensity was observed following treatment with ZFEs. In treated cells, PIP2 cytoplasm signal intensity increased, while the availability of Cofilin markedly decreased, both in the cytoplasm and in the nucleus. Moreover, PIP3 signal markedly decreased in the cytoplasm of treated cells. Data are presented as mean ± SD. Statistical analysis was performed with an unpaired two-tailed Student’s t-test. * p < 0.05; ** p < 0.01. (I,J) Western blot assay of PI3K (I) and PTEN (J) protein expression in MDA-MB-231 cells treated with 0.3 µg/mL ZFEs for 48 and 96 h. The analysis corroborated the data obtained from real-time PCR, revealing the decreased protein expression of PI3K in MDA-MB-231 cells after 96 h of ZFEs treatment. Analysis of PTEN expression showed no statistically significant difference following ZFEs treatment. Each sample was normalized against the relative expression of GAPDH. Data are presented as mean ± SD. * p < 0.05; *** p < 0.001.

(A,B) Representative confocal images depicting PIP3 (red) and PI3K (green) in MDA-MB-231 cells cultured under control conditions and after 96 h of ZFEs treatment. In control cells, PI3K was localized in the cytosol, positioned just behind the cell membrane, and exhibited co-localization with PIP3, suggesting the strong enzymatic activity of PI3K (A). In contrast, ZFEs treatment resulted in the perinuclear localization of PI3K, with the PIP3 signal nearly disappearing (B). Scale bars: 20 μm (C,D) Representative confocal images of PIP2 (red) and Cofilin (green) in MDA-MB-231 cells under control conditions and following 96 h of ZFEs treatment. Control cells displayed a dense distribution of Cofilin beneath the cortical ring, aligning with the F-actin pattern (C). After ZFEs treatment, Cofilin became dispersed throughout the cytosol of MDA-MB-231 cells. Additionally, an increased accumulation of PIP2 at the cell membrane, co-localizing with Cofilin, occurred (D). Scale bars: 10 μm. (EH) Fluorescence intensity analysis from nucleus and cytoplasm of PI3K, PIP2, PIP3, and Cofilin in MDA-MB-231 cells. Fluorescence intensity was evaluated with ImageJ Software. A significant reduction in PI3K cytoplasm signal intensity was observed following treatment with ZFEs. In treated cells, PIP2 cytoplasm signal intensity increased, while the availability of Cofilin markedly decreased, both in the cytoplasm and in the nucleus. Moreover, PIP3 signal markedly decreased in the cytoplasm of treated cells. Data are presented as mean ± SD. Statistical analysis was performed with an unpaired two-tailed Student’s t-test. * p < 0.05; ** p < 0.01. (I,J) Western blot assay of PI3K (I) and PTEN (J) protein expression in MDA-MB-231 cells treated with 0.3 µg/mL ZFEs for 48 and 96 h. The analysis corroborated the data obtained from real-time PCR, revealing the decreased protein expression of PI3K in MDA-MB-231 cells after 96 h of ZFEs treatment. Analysis of PTEN expression showed no statistically significant difference following ZFEs treatment. Each sample was normalized against the relative expression of GAPDH. Data are presented as mean ± SD. * p < 0.05; *** p < 0.001.

(A,B) Representative confocal microscopy analysis of F-actin (Red) and integrin-β1 (green) distribution in MDA-MB-231 cells cultured under control conditions or treated with ZFEs for 96 h. Control cells exhibited a dense network of stress fibers (A). After ZFEs treatment, F-actin began to reorganize along the cell membrane, with lamellipodia and filopodia being nearly absent (B). Scale bars: 10 μm. (C,D) Representative confocal microscopy analysis of β-catenin (red) and E-cadherin (green) distribution in MDA-MB-231 cells cultured in control conditions or treated with ZFEs for 96 h. In untreated MDA-MB-231 cells, β-catenin was primarily localized in the cytosol and E-cadherin was completely absent (C). ZFEs treatment promoted the accumulation of β-catenin/E-cadherin complexes at the cell membrane, facilitating cell-to-cell contact and the reconstitution of an epithelial-like architecture (D). Scale bars: 20 μm.

Wound-healing assay in MDA-MB-231 cells. (A) Representative phase-contrast images of the wound-healing assay taken 24 h after the scratch. The images were captured using an optical microscope. (B) Quantitative analysis of wound closure 24 h post-scratch. ZFEs treatment significantly reduced the motility rate of breast cancer cells. Values are expressed as the mean percentage of residual open area compared to the respective cell-free gap at T0. Data are presented as mean ± SD. Statistical analysis was performed using an unpaired two-tailed Student’s t-test. **** p < 0.0001. Scale bars: 250 μm.

Wound-healing assay in MCF-10A cells. (A) Representative phase-contrast images of the wound-healing assay taken 24 h post-scratch. Images were obtained via optical microscopy. (B) Quantitative analysis of wound closure after scratch. Normal breast cells, upon TGF-β1 treatment, exhibited migratory properties, almost completely filling the scratch area. However, ZFEs treatment reduced the migratory rate, with more than 50% of the area remaining open. Values are expressed as the mean percentage of residual open area compared to the respective cell-free gap at T0. Data are presented as mean ± SD. Statistical analysis was conducted using one-way ANOVA followed by Tukey’s multiple comparison test. * p < 0.05; ** p < 0.01. Scale bars: 250 μm.

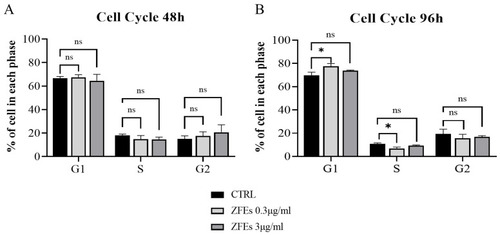
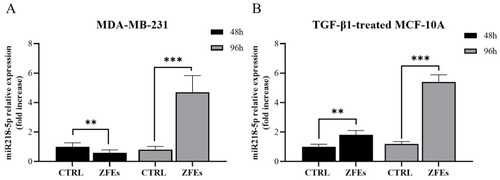
Graphs illustrating the relative expression of p53 (A) and TCTP (B) in MDA-MB-231 cells treated with 0.3 µg/mL ZFEs for 48 and 96 h. The Western blot analysis highlighted a direct correlation between p53 and TCTP expression. After 96 h of ZFEs treatment, p53 protein levels increased, while TCTP levels significantly decreased. Each sample was normalized against the relative expression of GAPDH. Data are presented as mean ± SD. * p < 0.05; *** p < 0.001.

Acknowledgments
This image is the copyrighted work of the attributed author or publisher, and ZFIN has permission only to display this image to its users. Additional permissions should be obtained from the applicable author or publisher of the image. Full text @ Int. J. Mol. Sci.