IMAGE

Figure 7

ID
ZDB-IMAGE-250510-22
Source
Figures for Monti et al., 2025
Image
Figure Caption

Figure 7

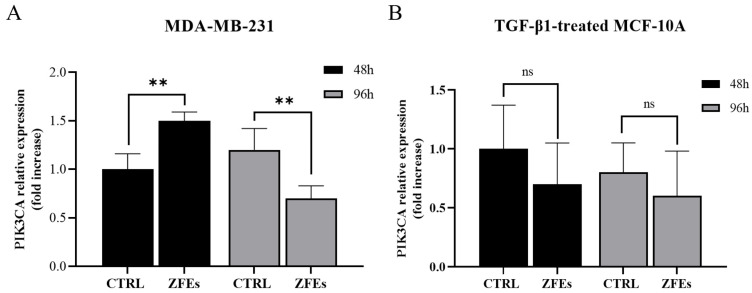
PIK3C2A expression. The transcription of PIK3C2A was analyzed in MDA-MB-231 (A) and in TGF-β1-pre-treated MCF-10A cells (B) at 48 (black) and 96 (gray) hours of treatment with ZFE 0.3 μg/mL. A significant decreased expression of PIK3C2A in MDA-MB-231 was observed after 96 h of ZFEs treatment compared to 48 h. A lower expression of PIK3C2A in MCF-10A cells was observed upon ZFEs treatment, although this was without statistical significance. Data are represented as the mean value ± SD. ** p < 0.01; ns: no significance.

Acknowledgments
This image is the copyrighted work of the attributed author or publisher, and ZFIN has permission only to display this image to its users. Additional permissions should be obtained from the applicable author or publisher of the image. Full text @ Int. J. Mol. Sci.