
- Title
-
Study of the Chemical Composition and Anti-Inflammatory Mechanism of Shiyiwei Golden Pill Based on UPLC-Q-TOF/MS and Network Pharmacology
- Authors
- Han, C., Chen, J., Shen, C., Liang, Q., An, Y., Zhou, C., Liu, K., Xia, Q., He, Q., Zhang, H.
- Source
- Full text @ Drug Des Devel Ther
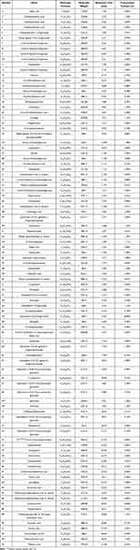
Total ion chromatogram of UPLC-Q-TOF/MS analysis. (A) Base Peak Chromatogram (BPC) of SYW samples in ESI- mode. (B) BPC of SYW samples in ESI+ mode. |
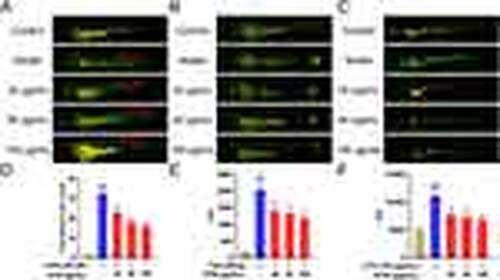
(A) SYW restrained CuSO4-induced inflammatory cell migration in zebrafish. The red arrow indicates the inflammatory cells at the lateral line. n = 8. (B) SYW inhibited tail-cutting-induced inflammatory cell aggregation. The red box area indicates the inflammatory cells that accumulated at the wound. n = 6. (C) SYW treatment ameliorated LPS-induced inflammation. n = 10. (D–F) show the statistical analysis of (A–C). All experiences were performed at least 3 times and data were expressed as mean ± SEM. ##P < 0.01 in contrast to the control group; **P < 0.01 in contrast to the model group. |
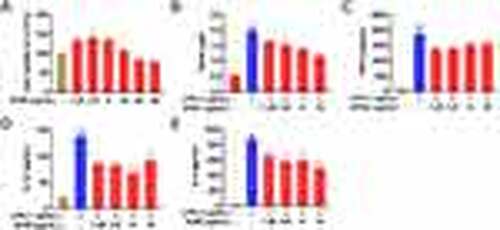
(A) Cell viability in the different SYW concentration groups. n = 6. *P < 0.05, **P < 0.01 in contrast to the control group. (B) Effect of SYW on the nitrite density. (C) The concentration of TNF-α. (D) The concentration of IL-1β. (E) The concentration of IL-6. n = 5. All experiences were performed at least 3 times and data were expressed as mean ± SEM. ##P < 0.01 in contrast to the control group; **P < 0.01 in contrast to the LPS group. |
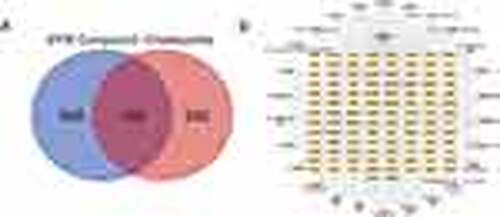
(A) Venn graph of the interaction between SYW and cholecystitis. (B) SYW-Targets-Cholecystitis visual network diagram. |
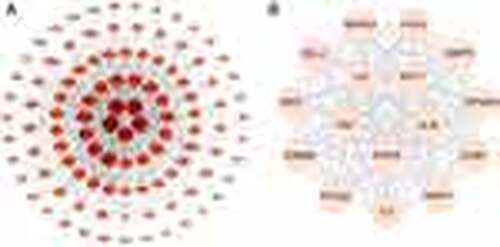
(A) The protein-protein interaction (PPI) network. (B) The 16 hub genes of SYW against cholecystitis. |
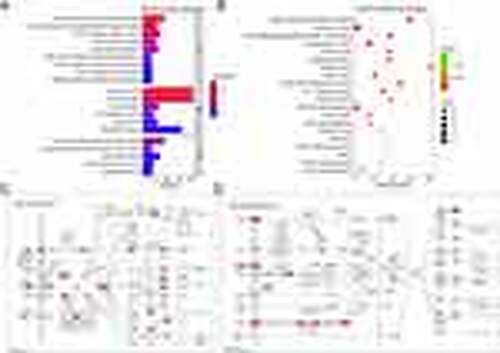
(A) The results of GO enrichment analysis. (B) The results of KEGG pathway enrichment analysis. (C) The PI3K-AKT signaling pathway map, red nodes represent relevant genes participating in regulation. (D) The FoxO signaling pathway map, red nodes represent relevant genes participating in regulation. |
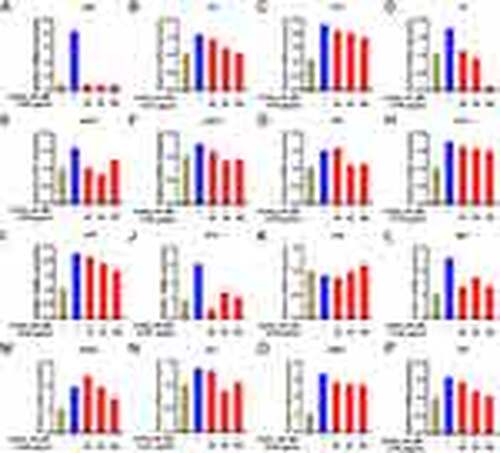
Effect of SYW on the expression levels of inflammation-related genes in zebrafish. (A) vegf. (B) irs1. (C) il7ra. (D) il6. (E) mapk3. (F) pik3ca. (G) akt1. (H) foxo1. (I) bcl6. (J) tnf-α. (K) hras. (L) egfr1. (M) mmp9. (N) esr1. (O) ptgs2. (P) il1β. n = 3. All experiences were performed at least 3 times and data were expressed as mean ± SEM. |
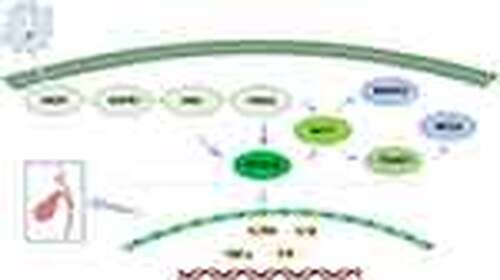
A conceptual framework describing the potential mechanism by which SYW in the treatment of cholecystitis. |