
Image
|
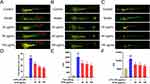
Figure Caption
Fig. 2 (A) SYW restrained CuSO4-induced inflammatory cell migration in zebrafish. The red arrow indicates the inflammatory cells at the lateral line. n = 8. (B) SYW inhibited tail-cutting-induced inflammatory cell aggregation. The red box area indicates the inflammatory cells that accumulated at the wound. n = 6. (C) SYW treatment ameliorated LPS-induced inflammation. n = 10. (D–F) show the statistical analysis of (A–C). All experiences were performed at least 3 times and data were expressed as mean ± SEM. ##P < 0.01 in contrast to the control group; **P < 0.01 in contrast to the model group.
Acknowledgments
This image is the copyrighted work of the attributed author or publisher, and
ZFIN has permission only to display this image to its users.
Additional permissions should be obtained from the applicable author or publisher of the image.
Full text @ Drug Des Devel Ther