
Image
|
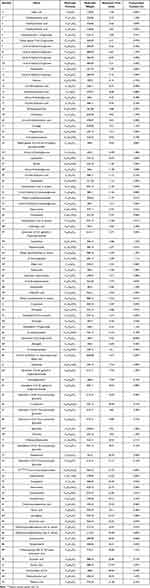
Figure Caption
Fig. 1 Total ion chromatogram of UPLC-Q-TOF/MS analysis. (A) Base Peak Chromatogram (BPC) of SYW samples in ESI- mode. (B) BPC of SYW samples in ESI+ mode.
Acknowledgments
This image is the copyrighted work of the attributed author or publisher, and
ZFIN has permission only to display this image to its users.
Additional permissions should be obtained from the applicable author or publisher of the image.
Full text @ Drug Des Devel Ther