
Image
|
Figure Caption
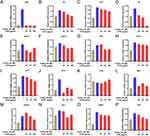
Fig. 7 Effect of SYW on the expression levels of inflammation-related genes in zebrafish. (A) vegf. (B) irs1. (C) il7ra. (D) il6. (E) mapk3. (F) pik3ca. (G) akt1. (H) foxo1. (I) bcl6. (J) tnf-α. (K) hras. (L) egfr1. (M) mmp9. (N) esr1. (O) ptgs2. (P) il1β. n = 3. All experiences were performed at least 3 times and data were expressed as mean ± SEM.
Acknowledgments
This image is the copyrighted work of the attributed author or publisher, and
ZFIN has permission only to display this image to its users.
Additional permissions should be obtained from the applicable author or publisher of the image.
Full text @ Drug Des Devel Ther