
Image
|
Figure Caption
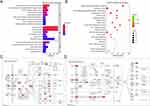
Fig. 6 (A) The results of GO enrichment analysis. (B) The results of KEGG pathway enrichment analysis. (C) The PI3K-AKT signaling pathway map, red nodes represent relevant genes participating in regulation. (D) The FoxO signaling pathway map, red nodes represent relevant genes participating in regulation.
Acknowledgments
This image is the copyrighted work of the attributed author or publisher, and
ZFIN has permission only to display this image to its users.
Additional permissions should be obtained from the applicable author or publisher of the image.
Full text @ Drug Des Devel Ther