FIGURE SUMMARY
Title

CITK modulates BRCA1 recruitment at DNA double strand breaks sites through HDAC6

Authors
Iegiani, G., Pallavicini, G., Pezzotta, A., Brix, A., Ferraro, A., Gai, M., Boda, E., Bielas, S.L., Pistocchi, A., Di Cunto, F.
Source
Full text @ Cell Death Dis.

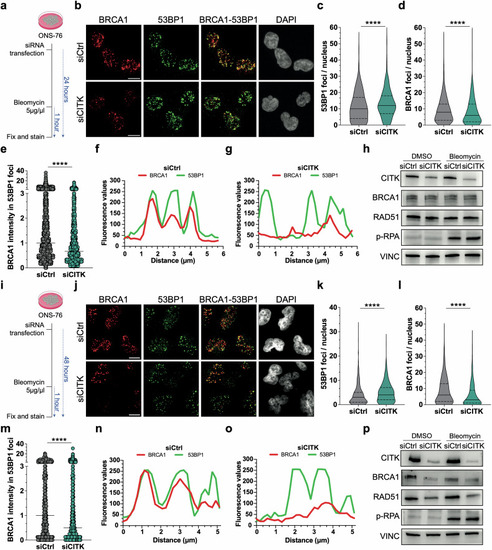
CITK knockdown reduces BRCA1 levels and colocalization between BRCA1 and 53BP1 after induction of DNA damage.

a, i Schematic representation of the experiments performed. b, j Representative confocal images of ONS-76 cells treated as highlighted in (a,i), respectively, immunostained for BRCA1 and 53BP1 and counterstained with DAPI. Scale bars: 10 μm. c, d, k, l Quantification of 53BP1 and BRCA1 foci per nucleus, in cells treated as in (b, j), respectively. e, m Quantification of BRCA1 signal intensity in each 53BP1 focus, in cells treated as in (b, j), respectively, after normalization to the median of control samples. f, g, n, o Examples of co-localization profiles between BRCA1 and 53BP1 signals in ONS-76 cells treated as (b, j), respectively. Fluorescence intensity was plotted for the two channels along a 6-μm-long line, randomly drawn in the nuclei of exemplar cells. h, p Western blot analysis of total lysate from ONS-76, obtained at the end of experiments performed as highlighted in (a, i), respectively. The levels of CITK, BRCA1, RAD51, phosphor-RPA were analyzed, and the internal loading control was Vinculin (VINC). All quantifications were based on at least four independent biological replicates; >300 cells were analyzed per condition in each replicate. ****P < 0.0001; Mann– Whitney U test.

CIT-K knockdown reduces BRCA1 levels independently from proliferative state.

a, g Schematic representation of the experiments performed. Quantification of the percentage of EdU positive ONS-76 cells 24 h (b) or 48 h (h) after transfection of the indicated siRNAs. Representative images of ONS-76 cells analyzed 24 h (c) or 48 h (i) after siRNAs transfection and treatment with 10 μM EdU for 30’, to label cells in S-phase. Cells were immunostained for BRCA1 and nuclei were counterstained with DAPI. Scale bars: 10 μm. d, j Quantification of BRCA1 foci per nucleus, in samples treated as in (c, i), respectively. e, k Quantification of BRCA1 foci per EdU-positive nucleus, in samples treated as in (c, i), respectively. f, l Quantification of BRCA1 foci per EdU-negative nucleus, in samples treated as in (c, i), respectively. All immunofluorescence quantifications were based on at least four independent biological replicates; >300 cells were analyzed per condition in each replicate. Error bars, SEM. *P < 0.05, ****P < 0.0001; unpaired two-tailed Student’s t-test for EdU positive cells; Mann– Whitney U test for foci.

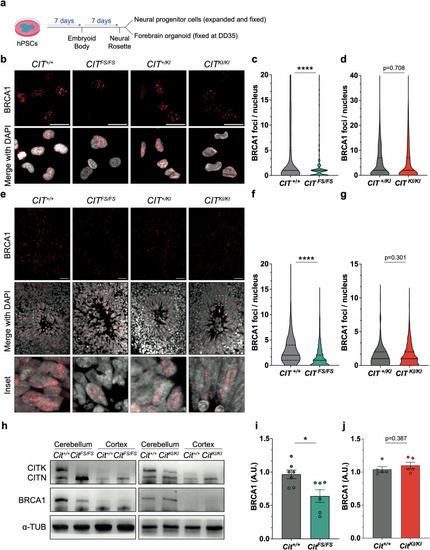
CITK scaffold activity, but not kinase activity, is required for regulation of BRCA1 levels during neurodevelopment.

a Schematic representation of the protocol used to obtain neural progenitor cells and forebrain organoid from pluripotent stem cells. Representative images of proliferating neural progenitor cells (b) or rosettes from DD35 organoid sections (e), carrying wild type, frameshift, or kinase inactive variants of CIT gene, immunostained for BRCA1 and counterstained with DAPI. Scale bars: 10 μm and 50 μm, respectively. c, d, f, g Quantification of BRCA1 foci per nucleus in each genotype and condition. h Western blot analysis of total lysate obtained from P4 cerebellum and P4 cortex of mice carrying wild type, frameshift, or kinase inactive variant of Cit gene. The levels of CITK and BRCA1 were analyzed, and the internal loading control was α-tubulin (α-TUB). i, j Quantification of BRCA1 levels in each genotype. Each dot indicates an independent biological replicate. Error bars, SEM. *P < 0.05, ***P < 0.001; unpaired two-tailed Student’s t-test for western blots, Mann–Whitney U test for BRCA1 foci. A.U. arbitrary unit.

CITK regulates acetylated tubulin levels and co-immunoprecipitates with HDAC6.

a Western blot analysis of total lysate from ONS-76 48 h after transfection of the indicated siRNA. The levels of CITK and acetylated tubulin (ac-TUB) were analyzed, and the internal loading control was α-tubulin (α-TUB). b Quantification of the relative density of ac-TUB in samples described in (a). c Schematic diagram of CITK protein domains (Kinase domain; Coiled coil, Rho-binding domain (Rho BD); Zinc finger (ZF), pleckstrin-homology domain (PH), Citron–Nik1 homology domain (CNH), PDZ domain) and of the different constructs used in the following panels. d Western blot analysis of total cell lysates (left) or RFP-Trap-based immunoprecipitations (right), obtained from 293-T cells transfected with constructs expressing Cherry-tagged CITK or with empty control vecto. The levels of RFP, HDAC6, and CYLD were analyzed. e Western blot analysis of total cell lysates (left) or anti-Myc immunoprecipitations (right), obtained from 293-T cells transfected with vectors expressing the indicated Myc-tagged CITK proteins. The levels of Myc, HDAC6 and CYLD were analyzed. f Western blot analysis of total lysate from ONS-76 48 h after transfection with the indicated siRNAs. The levels of CITK and HDAC6 were analyzed, and the internal loading control was Vinculin (VINC). Quantification of HDAC6 levels in siCITK cells relative to siCtrl. Nuclear (g) and cytoplasmic (h) fractionation of ONS-76 48 h after siRNA transfection. The levels of CITK and HDAC6 were analyzed, and the internal loading control was lamin A/C (LAM A/C) for the nucleus and α-tubulin (α-TUB) for the cytoplasm. Each dot indicates an independent biological replicate. Error bars, SEM. *P < 0.05, **P < 0.01. unpaired two-tailed Student’s t-test. A.U. arbitrary unit.

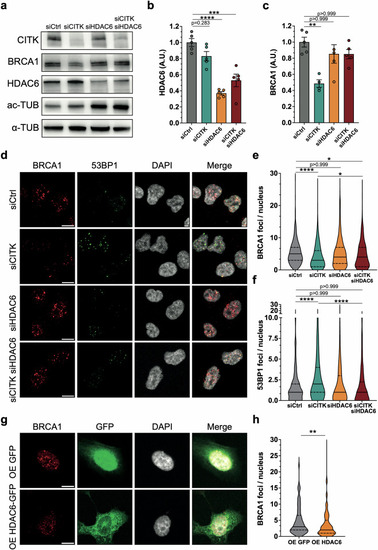
HDAC6 targeting recovers BRCA1 levels and DNA damage in CITK depleted cells.

a Western blot analysis of total lysate from ONS-76 cells, 48 hafter transfection of the indicated siRNAs. The levels of CITK, HDAC6, acetylated tubulin (ac-TUB) were analyzed, and the internal loading control was α-tubulin (α-TUB). b Quantification of the relative density of HDAC6 in each treatment condition. c Quantification of the relative density of BRCA1 in each treatment condition. d Representative images of ONS-76 cells, analyzed 48 h after transfection of the indicated siRNAs. Cells were immunostained for BRCA1 and 53BP1 and counterstained with DAPI. Scale bars: 10 μm. Quantification of BRCA1 (e) or 53BP1 (f) foci per nucleus in experiments performed as in (d). g Representative images of ONS-76 cells after transfection with GFP or HDAC6-GFP expression plasmids. Cells were immunostained for BRCA1 and counterstained with DAPI. Scale bars: 10 μm. h Quantification of BRCA1 foci per nucleus in samples treated as in (e) condition. Each dot indicates an independent biological replicate. All immunofluorescence quantifications were based on at least four independent biological replicates; >300 cells were analyzed per condition in each replicate. Error bars, SEM. **P < 0.01, ***P < 0.001, ****P < 0.0001; one-way ANOVA test followed by Bonferroni’s correction (b, c, e, f), unpaired Student’s t-test (h). A.U. arbitrary unit.

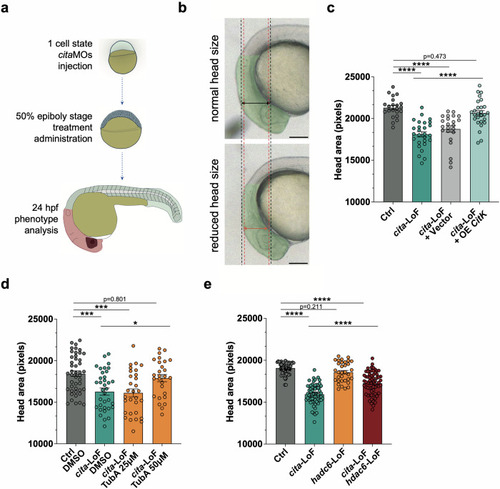
Targeting HDAC6 recovers microcephaly in MCPH17 Zebrafish model.

a Schematic representation of the experiment performed. b Representative brightfield images of the head region of 24 hpf embryos showing normal or reduced head size. Scalebar = 100 μm. c Quantification of the lateral head area under control conditions, after injection of cita-LoF morpholino oligonucleotide and after co-injection of cita-LoF with control vector or Cit-K expression vector. d Quantification of the lateral head area under control conditions and in cita-LoF embryos treated with DMSO or Tubastin A at the indicated concentrations. e Quantification of the lateral head area under control condition of after injection of the indicated morpholinos. Each dot indicates a single embryo. Error bars, SEM. *P < 0.05, ***P < 0.001, ****P < 0.0001 one-way ANOVA test followed by Tukey’s correction.

Acknowledgments
This image is the copyrighted work of the attributed author or publisher, and ZFIN has permission only to display this image to its users. Additional permissions should be obtained from the applicable author or publisher of the image. Full text @ Cell Death Dis.