|
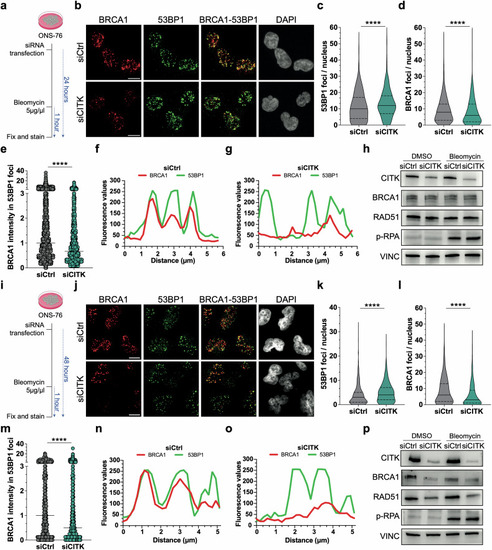
CITK knockdown reduces BRCA1 levels and colocalization between BRCA1 and 53BP1 after induction of DNA damage. a, i Schematic representation of the experiments performed. b, j Representative confocal images of ONS-76 cells treated as highlighted in (a,i), respectively, immunostained for BRCA1 and 53BP1 and counterstained with DAPI. Scale bars: 10 μm. c, d, k, l Quantification of 53BP1 and BRCA1 foci per nucleus, in cells treated as in (b, j), respectively. e, m Quantification of BRCA1 signal intensity in each 53BP1 focus, in cells treated as in (b, j), respectively, after normalization to the median of control samples. f, g, n, o Examples of co-localization profiles between BRCA1 and 53BP1 signals in ONS-76 cells treated as (b, j), respectively. Fluorescence intensity was plotted for the two channels along a 6-μm-long line, randomly drawn in the nuclei of exemplar cells. h, p Western blot analysis of total lysate from ONS-76, obtained at the end of experiments performed as highlighted in (a, i), respectively. The levels of CITK, BRCA1, RAD51, phosphor-RPA were analyzed, and the internal loading control was Vinculin (VINC). All quantifications were based on at least four independent biological replicates; >300 cells were analyzed per condition in each replicate. ****P < 0.0001; Mann– Whitney U test.
|